- Buyers — who is this person, and do I need to do anything about them? (Parts 1–4)
- Demographics — who are my customers as a group, and where are they? (Parts 5–8)
- Retention — who is worth naming on air tonight, who is about to slip away, and which shows bring people back? (Part 9)
The row of three buttons under the page title switches screens. The pill strip further down the Buyers tab (All / VIP / Repeat / …) filters one table. They deliberately look different for that reason. Switching tabs replaces the current history entry rather than adding one, so the browser's Back button leaves Customers instead of stepping between the tabs.
On the Buyers tab, what you are looking at is kept in the address bar — the segment, the sort, the page, the search, and any buyer whose profile is open. That view is a link: bookmark it, reload it, or send it to someone and they land on exactly what you were looking at. Opening a buyer adds a history entry, so Back closes the profile rather than leaving the screen.
customers.read permission — which a packer does not
hold. All three tabs are gated on it, including Demographics: the same population viewed as an
aggregate is still the same population. Every money figure is blanked to an em dash for anyone
without finances.view, and on Demographics the GMV and AOV map metrics disappear
from the metric switcher entirely rather than painting the map grey.
How a buyer is put together
Before any number means anything, it is worth knowing what "one customer" is on this screen — because the obvious answers are all wrong.
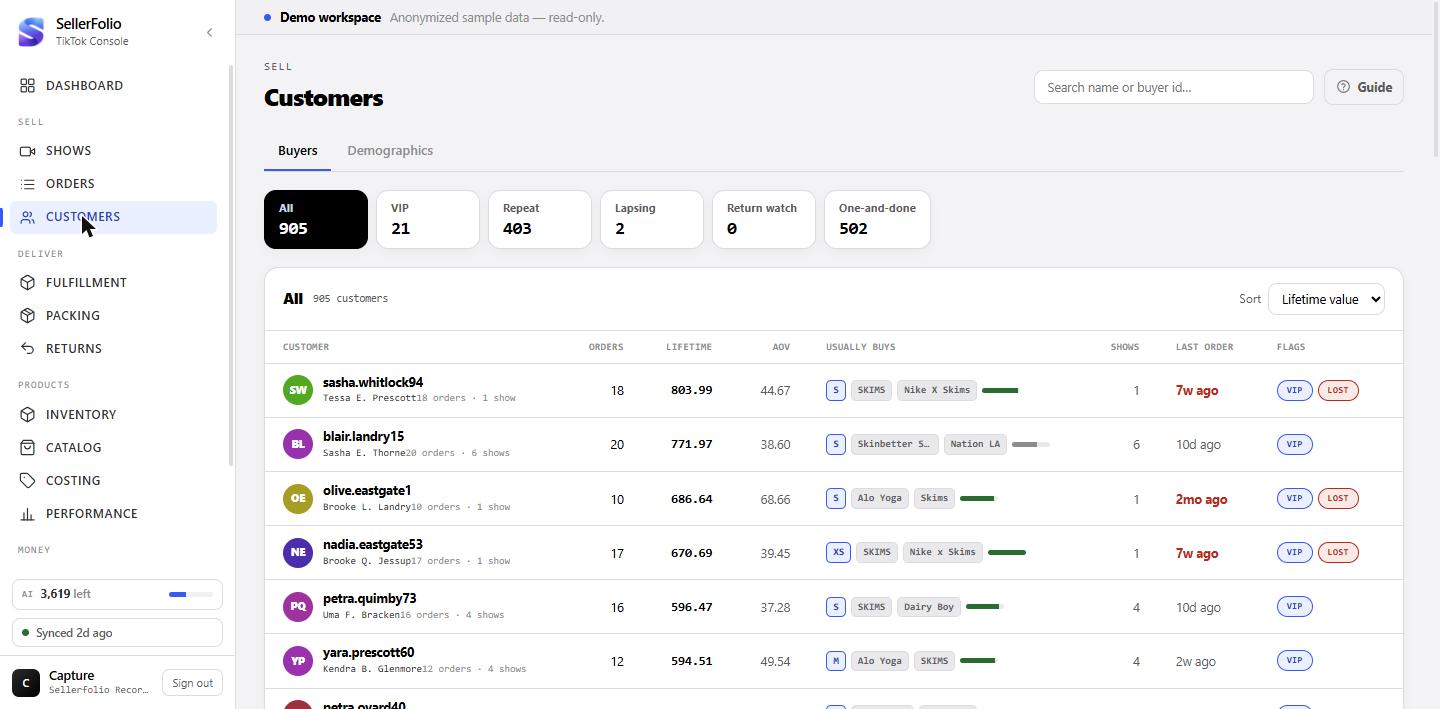
One row is one TikTok buyer id
Buyers are grouped on TikTok's opaque, stable per-shop buyer id — present on every order in the book. It is deliberately not email and deliberately not nickname:
- Every buyer email is a TikTok relay address, and a buyer can carry more than one of them. It identifies nothing and is not stable.
- A nickname is a display name, not a key. Nicknames are not unique: in any book of reasonable size a share of buyers will share theirs with someone else, common first names and bare punctuation marks most of all. Buyers also change their nickname over time.
Nothing has ever been mixed up, because every row is keyed on the id. But it is why the name you see is built the way it is.
The name, and the smaller name under it
The big name is the buyer's nickname. The greyer line under it is the most recent unmasked shipping recipient name, and it exists purely so two rows with the same nickname are tellable apart — it resolves very nearly every nickname collision on its own.
It is shown on every row rather than only on collisions, on purpose: the grid pages 50 rows at a time, so a "is this name duplicated?" check on the page you are looking at would stay silent for a collision that straddles two pages. The second line is suppressed only when it is the nickname again in different punctuation.
F******** V***) on
exactly those orders and on nothing else. A masked name is never rendered — a name the
seller does not recognise is worse than no name.
The coloured circle is an avatar generated from the buyer id, so a face keeps its colour between sessions. Its initials are taken from the letters and digits in the nickname only — real nicknames are full of emoji and decoration, and a naïve first-character rule would put an emoji in the circle as often as a letter.
The Buyers grid
Eight columns, and two of them will surprise you.
The money columns cover the whole order book, cancellations included
Orders, Lifetime and AOV are computed over every order that buyer has ever placed in your shop, at any status. Nothing is excluded for being cancelled, unpaid or refunded. That makes the figures a complete record of the relationship rather than a settled-money figure — which is the right read for "who is this person", and the wrong one if you were about to quote it as revenue. Finance is the screen for revenue.
AOV is simply Lifetime ÷ Orders. Shows counts the distinct live rooms their orders came from; orders placed outside a live show have no room and count toward nothing here.
"Usually buys" — and the little bar next to it
The tags are the buyer's most-bought size and top two brands. They come from the AI transcript of the live show, projected onto each order — which is to say they exist only where transcript capture actually ran. The short bar beside them is the coverage meter, and it is the honesty control for the whole cell: hover it and it tells you what percentage of that buyer's orders the profile was actually built from.
Coverage is counted against the buyer's total order count, never against the orders we happened to find a transcript for. A profile drawn from 30 of 124 orders reads 24% and must not look like one drawn from 101 of 113.
Last order changes colour only for VIPs
The recency cell turns amber at 22 days and red past 45 — but only for a VIP. That is deliberate. A one-time buyer who has not come back in a month is the normal case and there are thousands of them; tinting those would bury the hundred that matter. On a non-VIP the cell is always neutral, however old it is.
Segments, flags, sort and search
Six pills narrow the table. Three pills on a row call out a buyer. They are related but they are not the same set.
The six segment tabs
All · VIP (10 or more lifetime orders) · Repeat (more than one) · Lapsing (a VIP quiet for 22 to 45 days) · Return watch · One-and-done (exactly one order). Every threshold is in the reference table with the reasoning behind the number.
Lapsing, and the Lost flag that has no tab
Lapsing and Lost are VIP-only by construction: both ask "has a good customer gone quiet?", and the question is meaningless for someone who bought once. Lapsing is 22–45 days of silence — a window chosen because it is still early enough to act. Past 45 days the pill becomes Lost, which is rendered on the row but has no tab of its own. To find them, open VIP and sort by Most recent; the Lost ones sit at the bottom.
Return watch needs both halves of its rule
A buyer is on return watch when they have 3 or more lifetime returns and their own return rate is at least twice the shop's. The count is the evidence — three returns is a pattern, one is a Tuesday. The rate is the signal: three returns across two hundred orders at a 1.5% shop rate is exactly average, and flagging that buyer punishes them for being loyal.
The rate is always computed on distinct orders that came back, never on the raw count of return records. TikTok can mint several return records against one order — there is a real buyer with one order and seven of them — and dividing records by orders renders 700%, which reads as a bug rather than a fact.
Sorting, and the one thing search does that you would not expect
Sort offers lifetime value, order count, most recent and average order. Search matches the nickname, the shipping recipient name, or an exact buyer id.
Opening a buyer
Clicking a row opens the full profile in a drawer. Escape closes it.
The three stats, then the profile
Lifetime with the date of the first order, AOV with the order count, and Last order in days. Below that, Usually buys — the same size and brand story as the grid cell, but stated in full: a coverage banner in words — "62% coverage. Built from the 78 orders that have a transcript", give or take whatever this buyer's real figures are — then size bars, then brand bars with each brand's share, then the colours mentioned on air. Under 50% coverage the banner turns amber and tells you to treat the profile as indicative; at 80% or above it turns green and says it is solid enough to act on.
Brand names are folded case-insensitively before counting, because the same brand is stored
under several spellings — Figs and FIGS are two rows in the
database. Unfolded, a buyer's top brand can be split in half and lose to a runner-up. The
spelling shown is whichever occurs most, so you see the form you actually use.
Colours are counted the same way and are deliberately not mapped to a colour taxonomy. "Onyx", "Espresso" and "Candlelight Yellow" are the words used on air to sell the item; folding them into black, brown and yellow would trade the seller's own vocabulary for a guess.
Shows, returns, recent orders
Shows they buy from ranks the live rooms this buyer actually turns up to, by spend, up to twelve. Orders with no room are left out rather than bucketed as an unnamed show — they are ordinary non-live sales.
Returns shows the raw count, the amount refunded, how many distinct orders came back, and the resulting rate. When the buyer is on return watch, a line above it states the comparison in full — "4 returns across 29 orders — 13.8%, about 9x the shop average of 1.5%". That comparison is withheld when it would rest on fewer than three orders: at one order the only non-zero rate that exists is 100%, which against a 1.5% shop rate is automatically "67x" for everybody, before anything about the person is considered. The counts and the rate are still shown; only the multiple is held back.
Recent orders lists the last 25 with their show, item count, amount and status — returned orders are marked. Click one to open the full order.
Demographics: the filter row
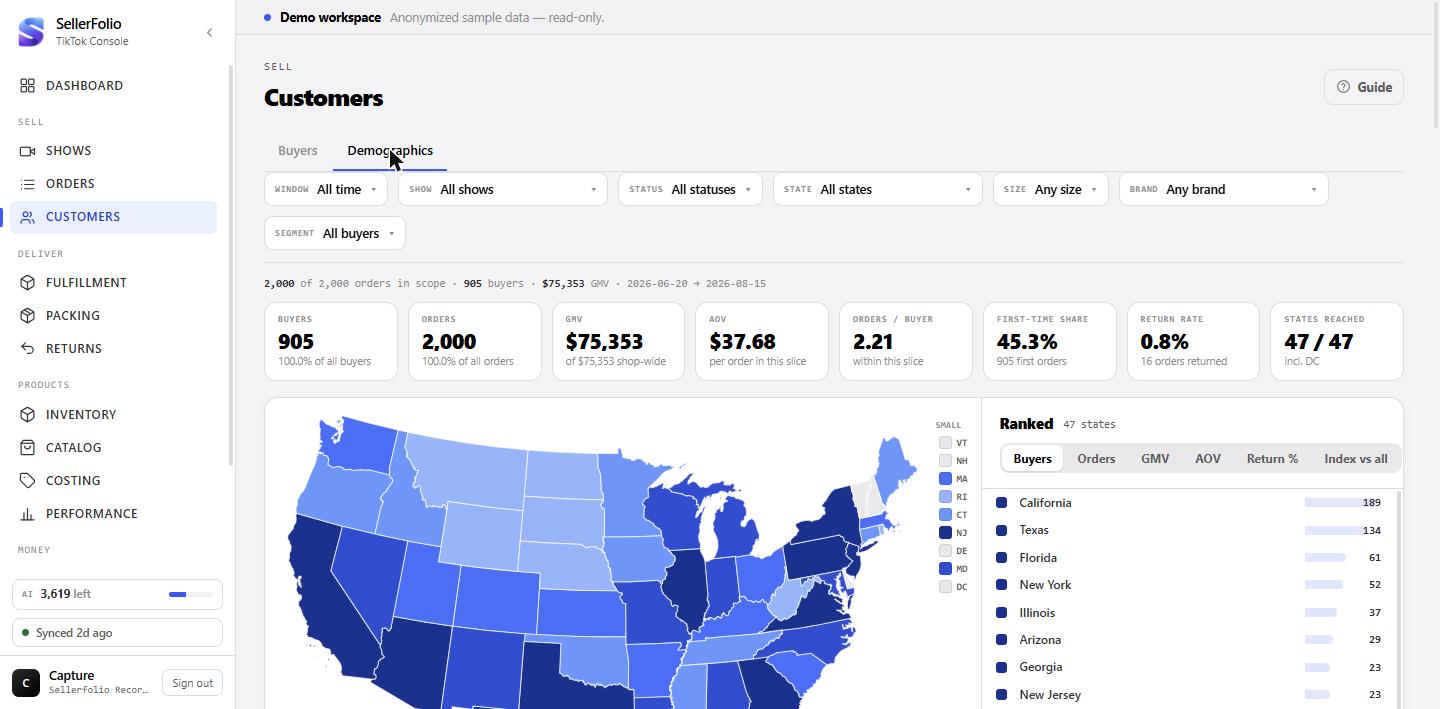
One row of controls at the top, and it scopes the entire page. There are deliberately no per-panel filters, so a figure read off one card can always be compared with a figure read off another.
Dates, shows, status, state, size, brand, segment
Every option in every dropdown carries the number of orders it would yield. Those counts are computed with every filter applied except the one you are choosing in — so picking one show does not make every other show read "0" and become unfindable. For the same reason, every option the shop has ever had stays listed even when the current slice reduces it to zero: a list that drops options on selection makes the thing you just picked impossible to find again.
The date presets are relative to the last order in your shop, not to today. A shop that has not broadcast for a fortnight would otherwise get an empty "Last 7 days" and read as broken.
The scope line and the eight KPIs
The line under the filters — "4,102 of 21,782 orders in scope · 2,731 buyers", to invent some numbers — is the one place that tells you how much of the shop you are looking at. Underneath, Buyers and Orders carry their share of the whole shop, and GMV carries the shop total to compare against.
First-time share counts orders that are the buyer's first ever order in your shop, not their first in the window you selected. That is what makes it an acquisition number rather than a windowing artefact. States reached is how many US jurisdictions this slice reached out of all fifty-one there are — fifty states plus DC, which is what the incl. DC line underneath is telling you.
The map
Geography is the strongest data on this screen — a shipping address exists on 100% of orders. The map is also an input: clicking a state scopes the whole page to it.
Six metrics, five classes, two ways to cut them
The metric switcher sits above the ranked list: Buyers, Orders, GMV, AOV, Return % and Index. The colour ramp has five classes over the states that have orders in the current slice, and you choose how the cuts are made:
- Quantile puts an equal number of states in each class, so the map reads as a ranking. Its cost is real — your largest state and a mid-sized one can land in the same class.
- Magnitude uses equal-width bands on a compressed scale, so the map reads as absolute size and the top two or three genuinely stand out. Plain linear bands would put forty-nine states in class one, which is why the scale is compressed.
Neither is "the" right answer, which is why the screen offers both instead of picking silently. Grey means no orders in this slice — never "no customers"; it is a separate fill and never a step of the ramp.
Hatched states: what we refused to say
A ratio over a handful of buyers swings wildly — one buyer in a small state can read as 2.5x over-indexed, and a map that paints that dark states it as a fact. So the server applies two floors: a state needs 5 buyers before it gets an index, and 10 orders before its AOV or return rate is treated as a value.
Below those floors the row is still returned — the counts are real and you should see them — but it is drawn as a hatch, not a colour, and it sorts to the bottom of the ranked list regardless of value. A hatch cannot be misread as a value the way any fill from a ramp can. Among the hatched rows the ordering is by buyer count, so the ones nearest to qualifying come first.
Index vs all — the metric the filters exist for
Index compares this slice's state mix with your shop's overall mix. 1.00× is exactly your normal mix; 1.6× on Texas means Texas is 60% over-represented in whatever you filtered to. It is drawn on a diverging ramp with a neutral grey middle, so "normal" reads as nothing rather than as a value.
Everything the map encodes is repeated as text at the bottom of the page under The map as a table — buyers, share, orders, GMV, AOV, return rate and index per state, with the same hatching rules expressed as em dashes. Rows are clickable there too.
Below the state line, and when they buy
Prefer ZIP3 over the city field
ZIP3 is the first three digits of the shipping postcode — a real postal area, tagged with the state it most often ships to in the current slice. It is the trustworthy sub-state unit.
When they buy
Orders by weekday × hour, Monday first. The clock is US Central for every buyer — a single approximation for a US-wide buyer base, used consistently across the whole product so two screens can never disagree about which day a 1am order belongs to. It is daylight-saving aware. Switch Heat to Values to read the counts; hovering any cell gives the count and its share.
What they buy, loyalty, and audience by show
Size, brand and colour — read the coverage bar first
These three panels are the only thing on the screen that resembles a demographic attribute, and they exist only where transcript capture ran. Each card carries a coverage bar — "Size known · 1,240 / 4,102 · 30%", to keep inventing numbers — and that bar is the first thing to read, because the shares below it are computed over the orders that have the dimension, not over all orders. Bars that summed to 53% because half the orders were never transcribed would read as a data error.
Size is the one ordinal panel: XS→4X has a natural order, so the rows keep that order and the colour ramps along the scale rather than along the ranking. Buckets that are not points on that scale — Bra, Numeric, Volume, Kids', One size — sort after it and are drawn neutral, because they have no position on it. Numeric covers any size given as a plain number, waist sizes among them, so it is not read as a measurement of one particular thing. Brands and colours are nominal, so every bar takes the same hue and length carries the value alone.
Clicking a size or brand bar filters the page to it. Colours are display-only.
Frequency buckets read lifetime orders, always
The purchase-frequency buckets (1, 2, 3–4, 5–9, 10–24, 25+) count a buyer's lifetime orders, not their orders inside your filter. A five-plus buyer stays a five-plus buyer when the screen is scoped to a single show — which is what lets you ask "how much of this show's revenue came from my regulars?" and get an answer. Toggle between counting buyers and counting GMV.
First-time vs returning plots one column per day that actually had orders. Days with no orders are absent rather than drawn as zero — a shop that broadcasts on half the calendar days would otherwise render as a comb of empty columns.
Audience by show
One row per show in the slice: buyers, first-timers, % new, orders, GMV, AOV, the top state with its share, and unique viewers. Click a row to scope the whole page to that show — the map then answers "where did this show's buyers live", which is the question the index metric exists for.
First-time counts buyers whose first order in your shop ever landed in that show — the acquisition read, and the reason a show can report far more buyers than first-timers without anything being wrong. AOV blanks to an em dash on a show with too few orders to average honestly — the same sufficiency floor the map applies, set and applied on the server. The show's counts stay exact either way; it is only the ratio that is withheld, because an average over a handful of orders swings on one of them.
Retention: the room, the queue, and which shows recruit
The third tab. Buyers and Demographics describe who your customers are; this one is about keeping them — who is in tonight's room and worth naming on air, who is about to slip away while you can still do something, and which shows actually bring people back.
The four figures across the top
Value at risk adds up the lifetime value of every VIP currently in the win-back window. Read it as an upper bound on what is in play, not a forecast: it prices each buyer at everything they have ever spent, and a buyer who drifts away rarely takes all of that with them.
Lost within a week counts the ones past day 39 — they leave the window on their 46th quiet day and stop being counted as winnable. Comes back in N days is the median recruit rate across every show old enough to judge; the card names the window in its own heading, so read the number there rather than assuming one. In the room is the selected show's buyer count, with the milestone breakdown underneath. Pick All shows and the same card becomes Customers — every buyer you have, split by where they stand today.
Lost within a week is capped the same way and says so the same way. It is counted over the rows the queue is holding, so on a capped queue its sub-line tells you the number is a floor and over how many rows it was taken. Both figures come from one list, so neither can quietly describe a bigger population than the other.
In the room — who to name on air
Pick a show and this lists the buyers in it. It opens on your most recent show, and a show that is currently live carries a LIVE badge in the picker. Worth a shout-out is the default and the point of the panel: it narrows to buyers who either hit a milestone in this show or are VIPs. Everyone drops that filter.
Three milestones can appear. 2nd order — first repeat is the cheapest win in the book: the single hardest gap to close is one order to two. 10th order — new VIP marks the crossing. Back after N quiet days carries the gap because the gap is the point — “back” alone gives you nothing to say, where “back after 61 quiet days” does.
The strip above the table splits the room by kind — first-time, second order, repeat, VIP — with the spend each group put through tonight. A kind showing zero is drawn greyed rather than hidden, so the shape of the room is legible at a glance.
All shows is the top row of the picker, and it answers a different question: not what one broadcast did, but who your customers are. The heading changes to Across all shows, the Tonight column is replaced by Shows — how many broadcasts that buyer has bought in — and each row is labelled by standing rather than by milestone. The shout-out filter greys out while it is selected, on purpose: a milestone is something one show did to a buyer, so with no show picked there is nothing for it to narrow to.
Standing counts lifetime orders the same way the Buyers tab counts them, so a VIP here is a VIP there. Cancelled and unpaid orders are excluded from both. A show’s roster deliberately does not exclude them — it describes what happened in the room, and an order that was placed and later cancelled still happened.
Slipping away — the win-back queue
Every VIP between 22 and 45 days quiet, longest silence first. That sort is deliberate and it is not the same as sorting by value: the row at the top is the one closest to falling out of the window, not the one worth the most. Sorting this queue by lifetime value would bury the deadline, which is the only thing that makes it a queue rather than a list.
The Window column bands each row — freshest, most winnable through halfway to lost and lost within a week. Export CSV writes the rows you can see, with the buyer's name, days quiet, lifetime value, orders and what they usually buy.
Windows still open
The table below it ranks shows whose win-back window has closed — a finished result you can do nothing about. This one is the opposite: recent shows whose recruits are still inside their window, so there is still time to bring them back. Each row is one show, and the column that matters is Still to win — the first-time buyers it recruited who have not bought again yet.
A show whose recruits have all come back is not listed. That is a result, not work, and it belongs in the table below once its window closes. The list is ordered by deadline, soonest first, and it scrolls inside the card rather than being cut short — what you see is all of it.
Which shows recruit
A show recruits when someone places their first ever order in your shop during it. It counts as a keeper when that person orders again in a later show, inside the win-back window. The rate is keepers ÷ recruits, and the bar shows it against the shop median rather than against 100% — the median is the only honest comparison, since no shop converts every first-timer.
A show only appears once it clears the recruit floor and its window has closed. Both matter, and the second is the one people forget. At three recruits the rate can only be 0, 33, 67 or 100%, and a show that recruited three people and kept all three would otherwise top the table over one that recruited sixty-eight and kept fifty. The floor is set where a rate stops moving in steps too coarse to rank, and the window is long enough to cover several weekly cycles — so a show is judged on more than its first weekend.
Something looks wrong
Every profile says "no size data"
Size, brand and colour come from AI transcripts of your live shows. A shop that has never run transcript capture has none, and every profile is legitimately empty. Capture and transcribe a show and they start filling in.
A buyer's lifetime total looks too small
Check whether the search box is still filled in. A search filters the underlying orders, so a matched row's totals cover only the matched orders. Clear it, or open the buyer — the drawer is never search-scoped.
The map is almost entirely grey
Grey is "no orders in this slice". Either the filters are tighter than you meant, or you are
on a money metric without finances.view — in which case the metric switcher
drops GMV and AOV entirely rather than painting a grey map, so if you can still see them,
it is the filters.
A state's index looks enormous
If it is drawn as a value at all, it cleared the five-buyer floor. If it is hatched, the screen is telling you it will not stand behind that number — read the buyer and order counts in the table instead.
Every rule, with its threshold
The exact rule behind each flag, segment and column. Thresholds are shop-settable, so if yours have been tuned the numbers here are the defaults rather than your values.
Flags on a buyer row
| Flag | Exact rule | Why that number |
|---|---|---|
| VIP | 10 or more lifetime orders, any status. | Tuned so it selects a few hundred buyers rather than thousands — a list a person can actually work through. |
| Lapsing | VIP and 22 to 45 whole days since their last order, inclusive. | Catches VIPs while the gap is still early enough that contact means something. |
| Lost | VIP and more than 45 days quiet. Outranks Lapsing if both ever applied. | Both are VIP-only: one-time buyers go quiet in bulk every month, and flagging those would bury the ones that matter. |
| N returns (return watch) |
3 or more lifetime return records and distinct returned orders ÷ orders ≥ 2 × the shop's own rate. With no shop baseline the count rule stands alone. | Count is evidence, rate is signal. The rate half stops a high-volume buyer being flagged for returning at exactly the shop average. |
| One-and-done | Exactly one lifetime order. | A segment tab only — it is never drawn as a pill on a row. |
Buyers grid columns
| Column | What it is |
|---|---|
| Customer | Nickname (or the shipping recipient name, or Buyer … + the last six
of the buyer id). The grey line beneath is the most recent unmasked recipient name,
shown to separate buyers who share a nickname. |
| Orders | Lifetime order count, every status included. |
| Lifetime | Sum of order totals over those same orders. |
| AOV | Lifetime ÷ Orders. |
| Usually buys | Top size, top two brands, and the coverage bar. Drawn only when a size resolved — brands alone will not fill this cell. |
| Shows | Distinct live rooms their orders came from. Non-live orders count toward nothing here. |
| Last order | Time since the most recent order. Tinted amber past 22 days and red past 45 — for VIPs only. |
| Flags | The pills from table A, capped so a row never becomes a wall. |
Returns arithmetic, precisely
| Figure | Definition |
|---|---|
| Returns | Return records. One order can carry several — there is a buyer on production with one order and seven records against it. |
| Orders returned | Distinct orders carrying at least one counted return. The only honest numerator for a rate. |
| Return rate | Orders returned ÷ orders. Never records ÷ orders, which can exceed 100%. |
| Shop average | The workspace's own rate on the same definition, over its whole history. It takes no date filter, so it is the same baseline everywhere in the product. |
| Counted return | A return request the buyer did not withdraw and the platform did not reject. TikTok mints a new record each time a request is edited; counting those made several buyers look like repeat returners with no completed return between them. |
| "about 9x the shop average" | Only stated when the buyer's rate rests on 3 or more orders. Below that the rate is a property of the sample size rather than the person. |
Demographics: sufficiency floors and segments
| Rule | Threshold | Effect |
|---|---|---|
| Index floor | 5 buyers in the state | Below it the state gets no index — hatched on the map, em dash in the table, sorted to the bottom of the ranked list. |
| Ratio floor | 10 orders | Below it AOV and return rate are withheld for that state or show. Counts and GMV stay exact. |
| Segment: First-time orders | — | Orders that are the buyer's first ever in your shop. |
| Segment: Repeat orders | — | Every order after a buyer's first. |
| Segment: VIP | 5+ lifetime orders | Orders from buyers with five or more lifetime orders. |
| Segment: One-and-done | exactly 1 | Orders from buyers who have ordered once, ever. |
| Segment: Orders with a return | — | Orders carrying at least one counted return. |
| Frequency buckets | 1 / 2 / 3–4 / 5–9 / 10–24 / 25+ | Lifetime orders per buyer. Fixed under every filter. |
Retention thresholds
| Figure | Exact rule | Why that number |
|---|---|---|
| Win-back window | VIP and 22 to 45 whole days quiet — the same window as the Lapsing flag in table A, so a buyer cannot be one and not the other. | Early enough that contact still means something, late enough that a buyer on their normal rhythm is not chased. |
| Lost within a week | Past day 39 — within seven days of leaving the window. | A week is the shortest notice on which you can realistically act before the row disappears. |
| Value at risk | Σ lifetime value of the VIPs in the window. Capped at 100 rows: above that it reads with a trailing “+” and names how many of how many it summed. | An upper bound, not a forecast. A capped list that looked complete would state a partial sum as the whole. |
| Recruit | A buyer whose first ever order in the shop landed in that show. | First-ever, not first-in-the-window — otherwise a returning buyer's first order of the month would count as acquisition. |
| Recruit rate | Recruits who ordered again in a later show, inside the win-back window, ÷ recruits. Shown only for shows that clear the recruit floor and whose window has closed; blank otherwise, never 0%. The window and the floor are both named on the card — see step 25. | The window covers several weekly cycles, so a show is judged on more than its first weekend. Below the floor the rate moves in steps too coarse to rank. The later-show condition is what makes it retention: a second order the same night is the same visit. |
| Milestones | 2nd lifetime order (first repeat), 10th (new VIP), or a return after a gap longer than the win-back window. | All three are moments worth naming on air, which is the only channel available — buyer emails are TikTok relays and there is no messaging API. |
Where each part of the profile comes from
| Signal | Source | Coverage |
|---|---|---|
| Buyer id, nickname, recipient name | The order record from TikTok. | Buyer id on 100% of orders. Nickname and recipient name absent or masked on cancelled orders. |
| State, city, ZIP | The shipping address on the order. | 100% of orders — the strongest field on the screen. City is county-polluted; ZIP3 is not. |
| Size, brand, colour | AI transcript of the live show, projected onto each order. | Wherever transcript capture ran, and nowhere else. Per-buyer coverage on one live shop ranged from 1% to 97%; the other shop has none at all. |
| Returns and refunds | TikTok return records, withdrawn and rejected requests excluded. | Complete for orders that have them. |
| Shows and viewers | The show record — room, name, start, unique viewers. | Viewers is a bare total with no breakdown of who watched. |
| Time of day | Order timestamp, rendered in US Central for every buyer. | An approximation, applied consistently product-wide. |
What this screen cannot see
Stated plainly, because several of these are things a screen called "Customers" is normally expected to know:
| Not available | Why |
|---|---|
| Age | No such field exists in TikTok Shop's order data, and it is not purchasable through the Shop API. |
| Gender | Same — nothing in the data carries it, and nothing here infers it. |
| Income or household | Same. Any figure claiming this would be invented. |
| Ethnicity | Same. |
| Who watched a show | TikTok reports a unique-viewer count per show and no breakdown behind it. Everyone else on this screen is a buyer. |
| A usable email address | Every buyer email is a TikTok relay address, and many buyers carry more than one. It cannot identify a person and is not a contact route you own. |
| A @handle | There is no handle field anywhere in the data. The nickname is a display name, and it is not unique — 6–11% of buyers share theirs. |
| A reliable city | TikTok's city field mixes real cities with county names and there is no way to separate them here. ZIP3 is the trustworthy sub-state unit. |
| Size or brand for an untranscribed order | Those come from AI transcripts of the live show. No capture, no profile — which is what the coverage meters are for. |
| Cross-shop history | Everything is scoped to one workspace. A buyer id that appears in two of your shops is two separate customers here, by design. |
Habits worth keeping
Read the coverage bar before you believe a profile
"Usually buys M" from 4 of 60 orders and "usually buys M" from 55 of 60 look identical until you look at the bar. It is on the row, in the drawer and on every Demographics dimension card for exactly that reason.
Work Lapsing before it becomes Lost
The 22–45 day window exists because that is where contact still changes the outcome. Past 45 days the pill turns Lost, which is a record rather than an opportunity.
Treat return watch as a prompt, never a verdict
Three returns at twice your shop rate is worth a second look at how the item was sized and described. It is not evidence of anything about the person, and the screen deliberately does not tell you what to do about it.
On Demographics, set a filter before reading the index
Unfiltered, the index compares the shop with itself and is 1.00× everywhere. Scope to a show, a size or a brand first — that is the comparison the metric was built for.
Quote ZIP3, not the city field
If a concentration finding is going to be acted on — a regional shipping decision, a targeted show — take it from ZIP3. The city column contains counties and cannot be cleaned up honestly.