- Overview — how did the period trade, and what needs attention? (Part 2)
- Catalog — which shows, brands and products earned it? (Part 3)
- Sell-through — how fast is stock leaving, and what is left? (Part 4)
- Discounts — what did the promotions cost you, and who used them? (Part 5)
- Returns — what came back, why, and from which brand? (Part 6)
- Shipping — does filling a box make or lose money? (Part 7)
- Ads & Ops — what did ads cost, and how fast did you pack? (Part 8)
The screen itself needs permission to read reports. Amounts are a second, separate permission: without it every dollar figure arrives blank, while counts, units, days, rates and coverage percentages all survive. That split is deliberate — Sell-through, Returns and Shipping were each built so their story still reads with the money hidden, because a table of dashes would look like "nothing sold".
One exception is worth knowing about: Sell-through reads the purchase and stock ledger, so it is gated on permission to see purchases, not reports. If you can open this screen but that one tab reports a loading error while every other tab is fine, that is what has happened — it is a permission, not a network fault.
The screen moved from /reports to /performance when the navigation
was regrouped: under a Products heading, "Reports" said nothing about what it reported
on. The old path still resolves, and it carries your query string across — so
/reports?tab=shipping lands on the Shipping tab, not on the default one. Nothing
you have bookmarked is lost.
This screen used to carry Money, Fees and Cash
tabs. Those answered questions the Money, Settlements and Cash Flow screens also answered — the
same figure had four homes and two of the components carried literally identical headings, which
is how two homes quietly disagree. Finance now owns all of it. The old links still work:
?tab=money sends you to Finance, ?tab=fees to Finance's
Costs & drivers, and ?tab=cash to Finance's Cash. The
components behind them were deleted; the redirects stay.
If a question is about whether the money is right — reconciliation, payouts, reserve, fee keys, statements — it belongs on Finance. There is a table at the end that splits the two.
The controls above the tabs
Everything above the tab strip re-scopes every tab at once. Read this part first — most of the confusing readings on this screen come from a filter that does not reach where you thought it did.
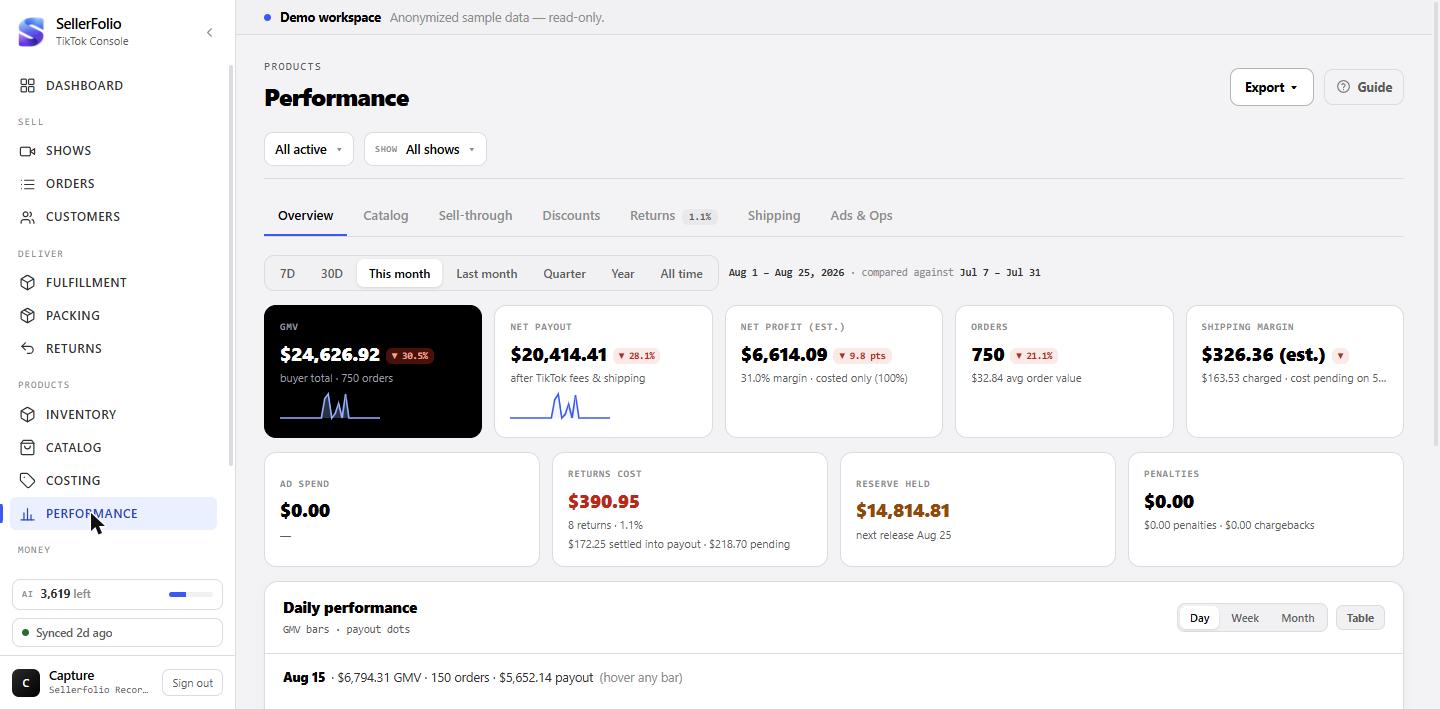
The period chips, and the period you are being compared against
Seven chips: 7D, 30D, This month, Last month, Quarter (the last 90 days), Year (this calendar year) and All time. This month is the default. The line beside them spells out the actual dates, then names the window you are being compared against — the immediately preceding stretch of the same length. Pick All time and it says no prior period to compare, because there is nothing before all time; every ▲/▼ arrow on the screen disappears with it.
The show and status filters
All shows is a multi-select — pick two broadcasts and every tab that honours the filter narrows to those two. The statuses on offer are the ones actually present in the period, not a fixed list.
Left alone, the screen excludes cancelled, refunded and unpaid orders throughout. A cancelled order never sold, and an unpaid checkout carries a full order total that was never collected. So every figure on this screen is net of cancellations and gross of returns — a returned order is still counted as a sale, with the return shown as its own cost.
Choosing statuses explicitly replaces that exclusion rather than narrowing within it. Tick Cancelled and cancelled orders come back into every figure, GMV included.
Not every filter reaches every tab — and that is deliberate
Four tabs read the shared report bundle and honour all three filters. Three tabs fetch their own data and take less, because taking more would silently change what their totals mean:
- Sell-through takes the window only. Its own status rule — cancelled, refunded and unpaid never counted as sold — is fixed on the server, and a product identity has no show dimension to filter on.
- Shipping takes the window and the show, but not status: its set is defined by "was shipped", and a parcel that was shipped and then cancelled still cost you postage.
- Discounts takes the window, show and status like the bundle tabs, but it can only see orders whose statement has been drilled — see Part 5.
Export and print
The Export ▾ menu holds three things. Export CSV is the order list for the current filters. Export .xlsx is the whole screen in eight sheets — Summary, Waterfall, By show, Products, Brands, Returns, Postings, Payouts — built from the data already on screen, so it never re-queries and never disagrees with what you are looking at. It exports the full tables, not just the page you are on — the CSV, being a row-per-order list, stops at a few thousand rows. Print swaps the interactive header for a plain title block and prints only the tab you are on; the other tabs were never rendered, so they cannot leak onto the page.
Overview
Nine figures, a trend, and a short list of things that want a decision.
The five headline figures
GMV is the buyer total for orders placed in the window, with the order count under it. Net payout is what TikTok settles after its fees and shipping. Orders carries average order value underneath.
Net profit (est.) is the one to read carefully. It is the result over the costed items only, not the whole business, and its sub-line says so: "N% margin · costed only (M%)". Whole-business profit would count an uncosted item's payout with no cost against it, so the more of your catalog is uncosted the better a whole-business figure would look — exactly backwards. The costed subset is the honest pair: profit over costed items, divided by their net sales.
Shipping margin is realized margin only — buyer-paid shipping less the label cost, counted on orders whose carrier bill has actually posted. A label often bills days after the sale, so while any order in the window is unbilled its buyer-charged shipping is not margin yet. Rather than inflate the number, that amount is named in the sub-line: "$X charged · cost pending on N orders".
The second row: ads, returns, reserve, penalties
Ad spend and Returns cost are clickable — they take you to the tab that explains them. Reserve held takes you to Finance, because reserve is Finance's subject. Penalties has no tab of its own, so it stays a plain card; it is penalties and chargebacks added together, with the split underneath.
Returns cost splits itself into what has already settled into your payout and what is still pending — the pending part is the money TikTok has not yet netted off a statement.
Returns cost follows your show and status filters, because a return belongs to an order. Ad spend and Penalties do not — they are statement postings, many of which belong to no order at all, so they are dated by the statement and narrow only with the period. Reserve held ignores even the period: it is a live running balance of what TikTok is currently withholding.
The practical consequence: filter to one show and GMV shrinks while ad spend does not, so the estimated ROAS beside it becomes meaningless. Read ROAS unfiltered.
The trend chart
Bars are GMV, dots are net payout, and the Day / Week / Month control changes the bucket. Leave it alone and the grain is picked from the span: up to about six weeks it draws days, up to about thirteen months it draws weeks, and beyond that months. Hovering a bar puts that bucket's figures in the line above the chart. The Table button in the card header swaps the chart for the same buckets as rows, which is also the accessible version.
Small dashed marks above a bar are ad statements that landed in that bucket. On day granularity, today's bar is tinted and the legend says LIVE — a partial day, not a collapse.
The insight cards, and exactly what triggers each one
These are not decoration; each one is a rule with a number behind it, and each links to where you would fix it.
- Shipping — green when realized shipping margin is zero or positive, red when it is negative. Both versions print buyer-paid against label cost.
- Items with no cost — fires whenever any line item in the window lacks a cost, names the biggest uncosted product by revenue, and tells you what share of GMV is "unprofitable on paper". Green when everything is costed.
- Sold below cost — fires when a costed line's recorded cost is higher than its sale price. That is a different problem from a missing cost: it is either a mis-keyed number or a real pricing mistake, so it gets its own flag rather than being buried in the margin maths. Review opens the drill drawer across every brand, already filtered to those lines.
- Best-performing slot — the show with the highest costed margin.
- Return rate — the watch line is 8%. At or above it the card turns amber; below it, green.
- Reserve and estimated ROAS — informational, and each hides itself when there is nothing to report.
Catalog
Two charts and three tables answering the same question at three grains: which show, which brand, which product.
The show quadrant
Every dot is a show: GMV across, costed margin up. The crosshair is not zero — it is the median of the shows actually plotted, so the quadrants are always relative to your own book and they move as you change the period. Four captions name them:
- Winners — high GMV, high margin. Protect and repeat these slots.
- Scale these — low GMV, high margin. More inventory or airtime.
- Watch — low GMV, low margin. Small and thin; keep or drop.
- Fix margin — high GMV, low margin. Big but leaky.
Click a caption and the By show table below filters to that quadrant's members; the table's subtitle then reads "N of M shows" with a chip to clear it. Click a dot and the show's own detail page opens in a new tab — deliberately, because this screen holds a pile of state (period, filters, sort, page, search) that navigating away would throw out.
The selling-time heatmap
GMV by weekday against two-hour blocks, Monday to Sunday. The card's footnote names the clock: orders by local (Central) time. It is a buyer-side view of when your money arrives, which is not necessarily when you were live.
By show
Viewers, orders, GMV with a share bar, profit and margin per broadcast, ten rows a page, sortable on every column. Profit (costed) and the margin pill are the costed subset for that room — a show with no costed order at all shows a dash rather than a zero.
The totals row is the sum of the rows this table is holding, and its label says which rows those are: All 41 shows when nothing was cut, Top 100 of 137 shows when the table stops at its hundred biggest by GMV, and Filtered · 12 of 100 shows when a quadrant filter is on. Read the label first and the totals mean exactly what they say.
By brand
The subtitle states the rule plainly: COGS and profit over costed lines only. The Costed column is a live X/Y — click it and the drill drawer opens on the uncosted lines specifically. Click anywhere else on the row and it opens on all of them. Profit shows the gross figure with the after-fees figure beside it in brackets.
Return rate is joined in from the returns data. The — no brand — bucket is a catch-all rather than a brand — it holds both untranscribed orders and transcribed ones that named no brand — so it sorts last in every column and every direction, and it never gets a return rate. Unlike Top products, this table is not capped: every brand in the period has a row.
The ✎ beside a brand name opens rename-and-merge. Two spellings of the same brand are two rows until you merge them, and merging is how the ranking becomes true.
Top products
Same shape, one grain finer — and one important qualifier in the subtitle: AI products, AI-transcribed only. A product exists on this table because a transcript named it. Anything sold without a transcript behind it contributes to GMV but has no row here, which is why this table's total will not match the period's order total.
MSRP is the mean across contributing orders, tagged est. when the value was inferred rather than spoken in the clip, with sold at N% underneath — your discount depth. The margin cell shows gross margin with net-after-fees beside it.
The drill drawer, which is also a repair tool
Opening a brand or product row lists its individual lines, with filter chips for All, Uncosted, Costed and — only when there are any — Below cost. The counts in the chips come from the same server scan the table used, so the drawer's X/Y always matches the row you clicked.
Costs are editable in place: type an amount and press Enter, or empty the box and press Enter to clear one. Focusing the box offers previous costs for that item. Above the list, a bulk bar applies one amount to every uncosted line currently loaded, and all-time → applies it to every uncosted line with that identity in any period — the "I have just priced this, make it stick" action. The all-time apply stops at a server-side cap and tells you when it did, so you can run it again for the rest.
An auto tag means the cost was stamped from a previous sale rather than entered by a person — worth a glance. A below cost tag with a red amount means that line's recorded cost exceeds what it sold for.
Sell-through
What is leaving, how fast, and how much is left behind it.
Read the coverage banner before anything else
The first thing on the tab is a sentence naming its own denominator: we can name the brand or size on N of M orders, then the breakdown — how many named a brand, how many resolved a size, how many were transcribed but named neither, and how many have no transcript at all.
This is first because the table is only as good as the transcripts behind it. A shop with no transcripts resolves nothing, and every row collapses into a single Unidentified line. A table showing only that row would read as "nothing sold", which is a claim about the business that the data never made.
The five totals
Units sold, revenue, cost of goods, gross margin and returned units — all covering the whole window including the orders that could not be identified, so they tie to the P&L rather than to the part of the table that happens to have a name.
Units, revenue and cost are all gross of returns; the Returned column is what came back. The cost card names its coverage ("N of M units costed") and the margin card says overstated — uncosted units carry no cost whenever that coverage is short.
The by-brand-and-size table
A unit is one line on one order. Velocity is units per day since that identity first sold inside this window — hover it and the tooltip spells out the units and the days. On hand is filled in only where every purchase bin behind an identity serves that identity alone. Where a bin is shared between sizes the cell reads shared and the tooltip says how many bins and how many units: a bin has no size, so that remainder cannot be divided between identities without inventing the split. Cover is highlighted once it drops to fourteen days or fewer, and needs both a velocity and a stock count the identity can actually claim.
Discounts
What the promotions cost you, as opposed to what they cost TikTok.
Yours versus TikTok's
Seller discounts is money you funded — it shows negative, because it is your cost. TikTok-funded shows positive: TikTok reimburses it and your payout is unaffected. Coupons is the two coupon families added together. Discounted orders gives the count and the share, and Avg seller discount divides your funded total by the discounted orders only — not by all orders.
Who used coupons, and their orders
The buyer table lists only buyers with at least one discounted order — but once a buyer is listed, their Orders and GMV columns cover all their orders in the window, not only the discounted ones. That is the comparison you want ("how much of this buyer's spend was discounted?"), as long as you know it is what you are reading. Click a row and the Discounted orders table below filters to them; click again to clear. Click an order and its full drawer opens.
Returns
Volume, reasons, trend and the brands behind it. The tab carries its rate as a badge.
The five figures, and what the rate is a rate of
Returns counts returns that are completed or processing — that is, every return except the cancelled and rejected ones, which never cost you anything. Return rate is that count as a share of the window's orders — its sub-line says of orders in window so the denominator is never a guess. Refunds is the buyer refund total, Return shipping is the labels you paid for, and Total cost is those two added.
By reason, by week, by brand
In Returns by reason the bar length is that reason against the biggest one, but the printed percentage is its honest share of the window's grand total — so the percentages add up to a hundred instead of the top reason always reading 100%. The subtitle names which basis is in use: total cost normally, count when amounts are hidden from you.
The trend is the weekly return rate and is built from counts, so it draws real bars even for a reader who cannot see money. Return rate by brand is ordered worst-first by the server, flags any brand at or above 8% with a ⚠, and puts the no-brand bucket last.
A return has no window of its own — it belongs to the window of the order it was raised against. So this tab answers "what has come back so far from the orders in this period", and the orders in a recent period have barely had time to come back at all.
Returns mature slowly: only a sliver of a cohort has come back by day seven, against most of its eventual total by days thirty to sixty. Read a 7D return rate as "nothing has come back yet", never as "nothing will", and never compare a fresh show against a mature one. The Returns screen's own analytics answers the other question — what came back during a window, regardless of when its order was placed — and the two rates are not interchangeable.
Shipping
One question, at parcel grain: does putting more orders in the same box make you money?
Why the curve is the headline
The chart plots shipping margin per order against how many orders shared one label — buckets of 1, 2, 3–4, 5–8 and 9+. The dashed line is break-even; green above, red below, with the sign printed on every point so colour is never the only signal.
It leads the tab because it is the finding. "We lost money on postage" is usually the smaller question — much of any loss is free shipping given deliberately. The bigger one is that consolidation is either your shipping profit engine or worth nothing at all, depending on the shipping arrangement your shop is on: on some arrangements per-order margin climbs steadily as boxes fill, on others it sits flat at every size. Which of those two shapes you are looking at is the decision the tab exists to give you.
The window here is order create time — the card header says so. Note that the grain is the parcel, not the order: in live selling most orders travel in a shared box, several to a parcel. Asking the same question one order at a time produces a wildly different-looking answer — it splits one parcel's postage across every order inside it and reports a crowd of "losing orders" that never existed.
Hollow points, thin lines, and a floor under the axis
A bucket is drawn hollow on a dashed segment with no shading when it falls under the sufficiency floor — too few parcels, or too few orders, behind it to read. The floor is set and applied on the server; the chart is told only whether a bucket clears it, and neither the chart nor this guide quotes the numbers, so a retune cannot leave either of them stating a threshold that no longer applies. The key under the chart says it outright: a hollow point is a shape, not a measurement. The confident shading stops at the last bucket that clears the floor, so a tail resting on one parcel is never painted as if it had been measured.
The four cards above the curve
Shipping margin · realized counts only parcels whose label cost has posted. Parcels that lost money counts charged parcels only. Free shipping is its own card because those parcels charged nothing on purpose and are not failures. Return-side shipping — the return label plus buyer postage refunded — is also its own card: it has nothing to do with box size, so folding it into the curve would corrupt the very thing the curve measures. Awaiting carrier bill counts the parcels excluded from every figure above, plus any untracked orders.
If a quarter or more of the parcels in view have no carrier bill yet, a banner appears above the chart and says so — costs post roughly ten days after the sale. Without it a freshly filtered recent show would read as "we barely ship anything" rather than "not billed yet".
Everything TikTok posts as shipping
This table is deliberately wider than the cards above it: every shipping component TikTok posted against this window's orders, pending parcels included, each row naming TikTok's own key. The rule under it is the point — revenue + outbound + returns + unclassified = net shipping.
The unclassified row is a tripwire and is rendered even when it is empty: a shipping key TikTok invents tomorrow lands there and appears on your screen, rather than dropping silently out of the total. Shipping-fee adjustments collapse into a single expandable row — they are postings rather than components, so they sit outside that sum and carry their own chip. The row opens itself the moment a correction actually posts, and otherwise reads "none posted", which is what both live books show today: this is a tripwire waiting for a first hit, not a summary of routine activity.
Parcels that lost money
The honest footnote under the diagnosis, ranked on the outbound label only. Free-shipping parcels are totalled on their own card and excluded here. Return legs are shown in their own column but never ranked on. Where a box carried orders from more than one show it is chipped mixed, which is a small minority of parcels. Only the worst parcels are listed, and the key says how many of how many you are seeing.
Ads & Ops
Two things that are not order data: what ads cost, and what the bench got through. Nothing on this tab responds to the show or status filters — none of it is attached to an order.
Ad spend and the honest ROAS caveat
Ad spend comes off the postings ledger at statement granularity, not daily, and the synced data carries no campaign identifiers at all. That means the ROAS beside it is a single window-level estimate — GMV against ad spend — and is tagged est. everywhere it appears. The card says this in its own words underneath. There is no per-campaign or per-creative breakdown to be had here; it does not exist in the data.
The Ad statements table lists each ad posting and its amount, newest first. Those same postings are the dashed markers on the Overview trend chart. One row is one posting rather than one statement, so a statement that carried two ad charges appears twice on the same date — read the column as spend events, not as invoices.
Packing and label spend
Packing is fulfilment throughput for the period: packages, items, active days and average time per package — average time being active packing seconds divided by packages, counted on calendar days rather than on order dates. Label spend is your own carrier labels bought through Shippo, dated by the label itself and split outbound versus return — a different thing from what TikTok bills you for TikTok Shipping, which lives on the Shipping tab and on Finance.
Something looks wrong
A tab ignored my filter
Check the filter table. Sell-through takes the window only; Shipping takes the window and the show but not status; Ads & Ops takes only the window. Neither the tab nor the filter is broken — the data behind them was never sent it.
Profit looks too good, or moved without any new sales
Read the coverage percentage in the Net-profit sub-line. Every uncosted line contributes revenue and no cost. Costing new lines moves the figure without a single new order, and so does a carrier bill finally posting against shipping margin.
Every Sell-through row says Unidentified
Nothing in that window was transcribed. The banner says so explicitly, in those words. It is not that nothing sold — it is that we cannot yet say what.
A brand shows no return rate
Either it genuinely had no returns, or it is the — no brand — bucket, which never receives one. The join itself ignores casing, so a spelling difference is not the cause.
Only the Sell-through tab fails to load
That tab reads the purchase and stock ledger and is gated on permission to see purchases, not reports. Every other tab working while that one shows an error is the signature of a permission, not a network fault.
The screen says it could not load the report
That box is deliberate, and it replaces every tab rather than letting them draw. With no bundle each tab would compute off zeros and render as a genuinely quiet period — no orders, no products, no returns, a flat trend — which is a claim about your business that a failed request never made. The tab strip stays live so you keep your place, and Retry re-fetches. Nothing was changed.
Discounts says I need finance access, but I have it
That card also appears when the window genuinely holds no drilled discount legs at all — the two states look identical from the inside, and the permission message wins. Widen the period or wait for the statements to settle; if discounts appear, you always had access. This is a known rough edge in the message, not in your permissions.
Half the amounts are dashes
Money is hidden as a unit for readers without finance permission — one visible amount means they all are. Counts, rates, units, days and the shipping verdict survive on purpose, so most of each tab still reads. Sell-through, Returns and Shipping were all built to stay useful in that state; Discounts collapses to a single "needs finance access" card, because with every amount hidden its counts mean nothing.
Figures, filters and boundaries
The exact arithmetic behind each number, what reaches which tab, which screen owns which question, and what this screen genuinely cannot see.
Every headline figure, with its denominator
| Figure | How it is worked out | Denominator |
|---|---|---|
| GMV | Buyer total across the window's orders. | — |
| Net payout | What TikTok settles after its fees and shipping. | — |
| Net profit (est.) | Profit over the costed items only — goods margin, plus the fees allocated to those orders, plus realized shipping margin. | Net sales of those same costed items. |
| Margin % (headline) | That costed profit divided by that costed net-sales base. | Costed net sales — never whole-business sales. |
| Coverage % in the sub-line | Share of sale revenue in the window that has a cost recorded against it — weighted by money, so one expensive uncosted item outranks a dozen cheap ones. | All sale revenue in the window. |
| Unsettled % (Discounts footer) | The complement of the settled share. | Orders TikTok has sent finance data for — not all orders in the window. |
| Shipping margin | Buyer-paid shipping less label cost, on orders whose carrier bill has posted. | — |
| Shipping charged (cost pending) | Buyer-paid shipping on orders whose label has not billed. Revenue, not margin. | — |
| Average order value | GMV ÷ orders. | Orders in the window. |
| Penalties (card) | Penalties + chargebacks from the postings ledger. | — |
| ROAS (est.) | GMV ÷ ad spend, to one decimal. Window-level only, never per campaign. | Ad spend posted on statements in the window. Note the mismatch: the GMV on top narrows with a show or status filter, the ad spend underneath does not — so only read this unfiltered. |
| Return rate (tab badge and KPI) | Returns counted ÷ orders, as a percentage. A return is counted against the window of the order it was raised on, not the date it was raised. | Orders in the window — so a recent window reports a young, low rate by construction. |
| Return share by reason | That reason's total cost ÷ the window's total return cost — or its count ÷ the total count when amounts are hidden. | The window's grand total, so the rows sum to 100%. |
| Return rate by brand | Returns raised ÷ orders placed under that brand. | That brand's orders — which is why it does not divide cleanly into the Qty column, and why an untranscribed order lands in the no-brand bucket. |
| Weekly return rate | Returns against orders created that week ÷ orders created that week. Weeks start on a Monday. | The orders of that week — every week with orders gets a bar, including a 0% one. |
| Show margin (By show, quadrant y-axis) | That room's costed profit over that room's costed net sales. | The room's costed subset only. |
| Brand margin | Gross profit (costed sales − COGS) ÷ costed sales. | The brand's costed lines only. |
| Product margin | Gross margin ÷ revenue, with net-after-fees shown beside it. | The product's revenue. |
| Sold at % of MSRP | Average sold price ÷ average MSRP. | Mean MSRP across contributing orders — tagged est. when inferred. |
| Velocity (Sell-through) | Units sold ÷ days on sale. | Days from that identity's first sale in the window to the window's end, floored at one day — not the length of the window. The column is shown so the rate can be checked rather than believed. |
| Cover (Sell-through) | Units on hand ÷ velocity per day, in days. | Needs both a velocity and a stock count the identity can claim; otherwise blank. |
| % sold (Sell-through) | Units sold ÷ (units sold + units on hand). | Blank whenever no purchase bin is bound to the identity. |
| Returned % (Sell-through) | Units returned ÷ units sold for that identity. | That identity's sold units — a ratio of counts, so it survives when amounts are hidden. |
| Shipping margin per order (curve) | Shipping revenue less the outbound label, divided across the orders that shared the parcel. | Orders in that box-size bucket, billed parcels only. |
| Avg seller discount | Seller-funded discount total ÷ discounted orders. | Discounted orders only — not all orders. |
| Period comparison (▲▼) | Change against the immediately preceding window of equal length. Margin compares in points, not percent. | The prior window's figure; omitted when it is zero, absent or hidden. |
Which filters reach which tab
| Tab | Period | Show | Status | Why |
|---|---|---|---|---|
| Overview | yes | yes | yes | Reads the shared report bundle. |
| Catalog | yes | yes | yes | Same bundle. |
| Returns | yes | yes | yes | Same bundle. |
| Ads & Ops | yes | no | no | Ad spend and penalties are statement postings — many belong to no order at all, so they are dated by the statement and cannot be narrowed to a show. Packing is counted by calendar day and label spend by the label's own date. |
| Discounts | yes | yes | yes | Its own fetch, same window parameters. Settlement-drilled orders only. |
| Sell-through | yes | no | no | Its status rule is fixed on the server; an identity has no show dimension. |
| Shipping | yes | yes | no | Its set is "was shipped" — a shipped-then-cancelled parcel still cost postage. |
This screen, or Finance?
| The question | Where it lives |
|---|---|
| Which show, brand or product made the money? | Performance · Catalog |
| How fast is this size selling, and what is left? | Performance · Sell-through |
| What came back, and from which brand? | Performance · Returns |
| Does filling a box pay? | Performance · Shipping |
| What did my promotions cost me? | Performance · Discounts |
| What did ads cost, and how fast did we pack? | Performance · Ads & Ops |
| Do my books agree with TikTok's? | Finance · Overview |
| What is the take rate, and what did the period earn? | Finance · Profitability |
| Which fee key is this, in TikTok's own words? | Finance · Costs & drivers |
| Which orders have settled, and on which statement? | Finance · Settlements |
| What has actually reached the bank, and what is held in reserve? | Finance · Cash |
| What is this one line item's cost? | Costing, or the drill drawer here |
What this screen cannot see
Each of these is a documented absence, not a bug to report.
| Gap | What it means for you |
|---|---|
| No campaign or creative breakdown for ads | The synced data carries no campaign identifiers. Ad spend arrives per settlement statement, so ROAS can only ever be a window-level estimate. |
| No daily profit or shipping-margin trend | The trend and the sparklines carry GMV and payout only. A recorded cost has no date attached to it at all, so any daily profit line would be invented rather than derived. |
| No product rows without a transcript | Top products and the Sell-through table are built from what the AI resolved. Untranscribed sales count in GMV and in the totals, but have no named row. |
| No stock split across a shared bin | A purchase bin has no size. Where two identities draw from one bin, on-hand reads shared rather than being divided by guesswork. |
| No unsettled discounts | Discount figures appear only once an order's statement has been drilled. |
| No unbilled shipping cost | Until a carrier bill posts, that parcel is excluded from every shipping figure and counted under "awaiting carrier bill". |
| No box size on a shipping adjustment | An adjustment belongs to no parcel, so it can never enter the consolidation curve. It is reported beside the margin, never inside it. |
| No return economics inside the curve | Return-side shipping has nothing to do with box size and is carded separately for that reason. |
| No show behind a statement posting | Ad spend, penalties, chargebacks and rebates are statement-level and many belong to no order at all. They cannot be attributed to a broadcast, which is why the show filter does not move them. |
| No cohort return rate | Returns here are pinned to their order's window, so a recent period's rate is young rather than final. The Returns screen answers the "what came back this month" version. |
| No reconciliation | Nothing on this screen tells you whether your books agree with TikTok's. That is Finance's first line. |
Habits worth keeping
Read the coverage line before the profit line
On Overview it is the percentage in the Net-profit sub-line; on Sell-through it is the banner at the top. Both name the denominator you are actually working with. A margin quoted from a half-costed window is how a good month turns into a bad surprise.
Compare shows at similar ages
Returns take weeks to arrive and carrier bills take days. Last night's show will always look cleaner and more profitable than one from six weeks ago, and neither figure is wrong — they are just at different points in the same curve.
Clear the uncosted queue from the drill drawer, not one line at a time
Open a brand from the Costed column, type the amount once, apply it to everything loaded, then use all-time → so the same item never comes back uncosted next month.
Merge brand spellings before you rank on them
Two spellings are two rows, splitting one brand's revenue in half and hiding it below the fold. The ✎ on the By-brand row fixes it everywhere at once.
Check the unclassified row on Shipping now and again
It should always be empty. It exists so that a shipping key TikTok invents next quarter shows up on your screen instead of falling quietly out of the total.