Four questions, one per tab:
- Work Queue — what needs a response, and by when? (Part 1–3)
- Analytics — what is coming back, from which brands and which shows, and what did it cost? (Part 4)
- Buyers — whose return behaviour is worth a human read, and what does the evidence actually say? (Part 5)
- Cancellations — which orders never shipped, and which of those you could have prevented? (Part 6)
A reference section at the end lists every classification rule, every threshold, the three different return rates on these screens, and the signals this system deliberately does not compute.
returns.read — including Cancellations,
which is order data but lives here. Money columns are separately gated: a viewer without the
finance permission does not see refund and label figures. On Analytics and Buyers, where every
cell in a column would be blank the column is dropped rather than filled with
dashes, which is why two people can open the same tab and count a different number of
columns. The Work Queue keeps its Refund and Your cost columns in place and dashes the cells
instead — the queue's columns are fixed so a row always reads the same shape, and a dash there
means the same thing it means everywhere: not "zero", but "not yours to see".
These screens hold a line that is worth knowing about before you read them, because it explains wording that otherwise looks over-careful:
- An observed figure is something measured — a rate, a count, a reason a buyer picked from TikTok's menu, an arbitration already decided.
- A hypothesis is printed under the words Likely cause to investigate, and never anywhere else.
So a return reason is what the buyer selected, not what went wrong. A high return rate is a rate, not a finding about a person. And nothing on these screens reports, blocks, scores or otherwise records a judgement about a buyer — the Buyers tab writes nothing at all.
Work the queue
The first tab is a to-do list with a deadline attached, ordered by that deadline. Everything above the table is a way into it.
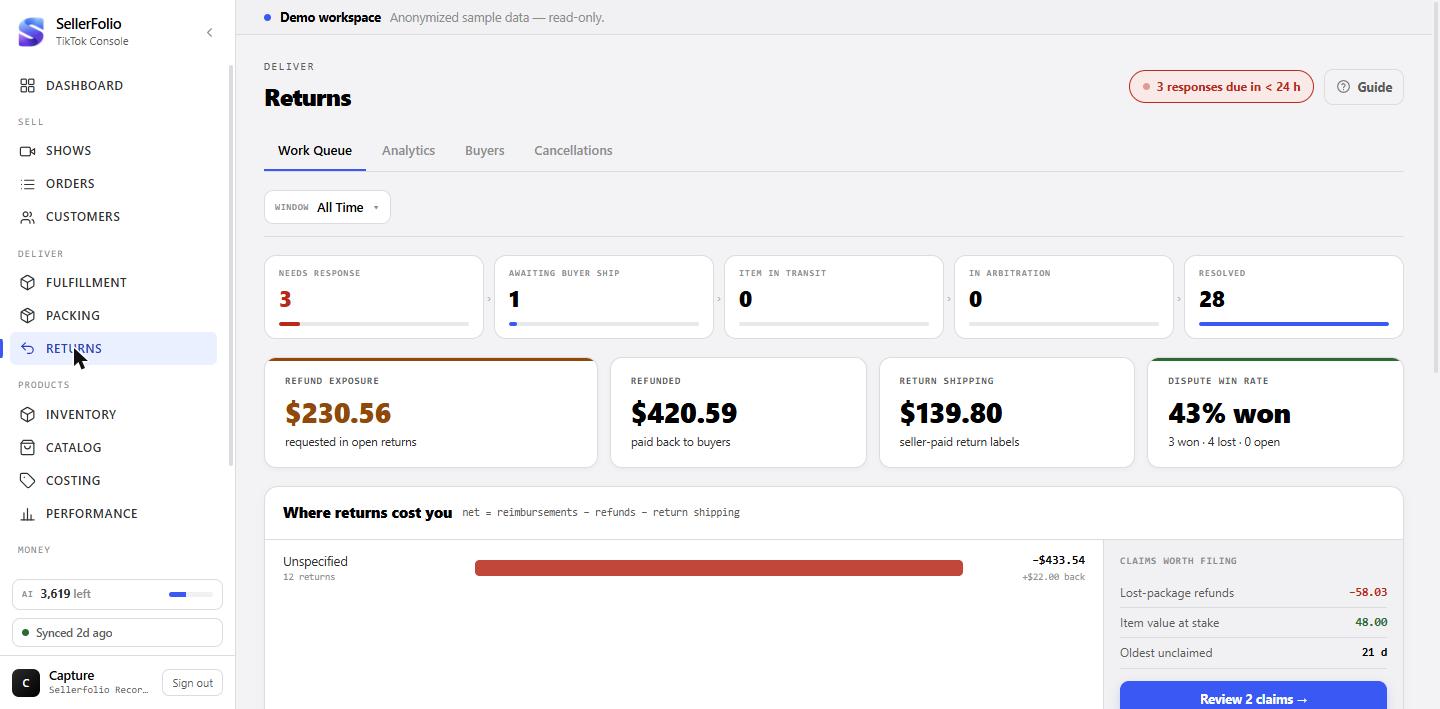
Read the alarm in the header first
When anything is overdue or due inside 24 hours, a red marker appears beside the timeframe picker — "3 responses overdue", or "2 responses due in < 24 h". Overdue wins the slot when both are true, because it is the worse fact. No marker means nothing is close to a deadline.
The pipeline: six stages, all clickable
Needs response is yours to act on and carries an overdue count under it. Awaiting buyer ship and Item in transit are waiting on the buyer. Arrived — inspect is back on your bench and waiting on you. In arbitration is with TikTok. Resolved is done. Clicking a stage filters the table below to it.
The four figures under it
Refund exposure is what has been requested in returns that are still open — money at risk, not money gone. Refunded is what has actually been paid back. Return shipping is the labels you paid for. Dispute win rate is arbitration only, with the won / lost / open split underneath.
The first, second and fourth carry a change figure against the previous window of equal length — pick Last 30 days and the comparison is the 30 days before that. There is no comparison on All time, and none when the earlier window was zero, so no change figure appears rather than an invented one.
Where returns cost you
One row per return reason, ranked by what it cost. The figure is a net: reimbursements − refunds − return shipping, so a reason TikTok reimbursed you for can come out positive and is drawn in the gain colour. Under each amount is either +$X back or nothing back — the second is the one worth noticing.
Bars are sized against the largest absolute net in the set, so the worst reason is always full width whichever direction it runs.
Under each amount is the arithmetic behind it — what went out (refunds plus any return shipping you paid) and what came back. Both are shown because the headline is a net: the money that came back is already inside it, so the two figures do not add together.
Click any reason to see the returns behind it. The panel opens with a plain sentence — what that reason cost you, what you refunded, and how much TikTok reimbursed — then the same figures grouped as money out and money back, and finally every refunded return, worst first. Click a record to open the full return.
Claims worth filing
The panel beside it finds refunds you paid on lost packages where no reimbursement has been posted. It shows the refund total, the item value at stake and the age of the oldest one, and the button drops you into a Claims view of the table.
Click a claim row to open the return behind it — what the buyer said, the status, the refund breakdown and the full timeline — with the claim's own figures at the top and a File in Seller Center button. That button opens the order in Seller Center, where the after-sales panel lives; it does not file anything for you.
Read a row
The table is sorted by response deadline and paged 50 at a time. Six filters sit above it, with a search box beside them.
The six filters
| Filter | Shows |
|---|---|
| All | Every return in the window. |
| Open | Anything not yet resolved, whoever it is waiting on. |
| Needs response | Waiting on you, with a clock running. The one that matters. |
| Completed | Settled, refunded, rejected or cancelled. |
| Disputes | Returns that went to arbitration. |
| Claims | Lost-package refunds with no reimbursement posted. A different table with its own columns. |
Search covers product name, SKU, order ID and reason text, and it runs on the server — a match on page 8 is found from page 1. It is hidden in the Claims view, which does not support it.
Respond by — the colour is the whole point
| Reads | Means |
|---|---|
| overdue (red) | The window has closed. TikTok's auto-approval works against you here. |
| Nh left (red) | Under 12 hours. |
| Nh left (amber) | Between 12 and 24 hours. Amber means the last day — there is no amber Nd Nh, because a day or more of slack is green. |
| Nd Nh (green) | One day or more. |
| — | No action is pending on this return, so there is no clock at all. |
The rest of the columns
Product carries the item, whether this is a Return + refund or a refund with no goods coming back, the SKU, and a return watch pill if this buyer is flagged — Part 5 explains what earns that. Refund is what the buyer asked for; Your cost is the return label when you are paying for it. Status is TikTok's own state, and Dispute is the arbitration verdict: Won, Lost, In arbitration, or Closed with no verdict.
Respond to a return
Clicking a row opens the return. Approving issues a real refund, so nothing acts from the table itself.
What you are offered depends on the return, live
The buttons are not a fixed set. Opening a return asks TikTok what is eligible right now and shows only that. Typically:
- Approve — the wording follows the stage: approve the returned package once it has arrived, approve the return, or approve the refund.
- Refund, keep item — a refund with no goods coming back. Worth it when the return label costs more than the item.
- Offer partial refund — a counter-offer at an amount you enter. Only offered when TikTok says it is eligible, which is not the same set of moments as approve.
- Reject — requires a reason picked from TikTok's own list, plus an optional comment.
Bulk approve, and what it will not do
Tick rows and a bar appears with the count and the total refund at stake. Approve all eligible and Refund, keep item both run one return at a time, re-checking eligibility on each — the same check the single-row path makes, so a bulk run can never take a decision the drawer would not have taken.
The result names every outcome: "12 approved · 2 not eligible · 1 failed". A partial run never reports a plain "done".
Analytics — what came back, and what it cost
Two windows only: last 90 days and all time. Returns are rare enough per week that a shorter window mostly shows noise.
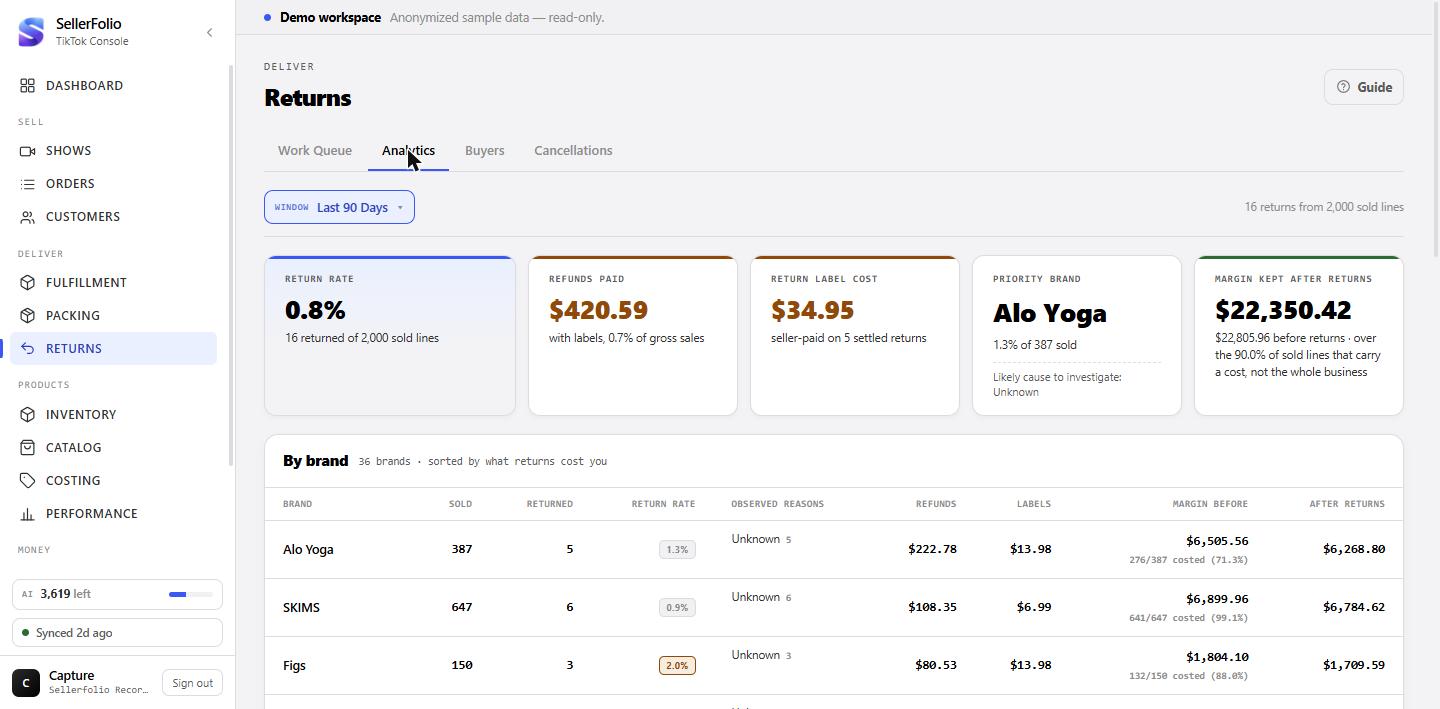
Return rate, and the denominator it uses
This tab's headline rate is return records ÷ sold lines, printed under the figure as "N returned of M sold lines".
Under that line the tile says how much of the window has finished maturing — the share of its orders now past their return window, and how many can still come back.
Refunds and labels are two tiles, never one total
Refunds paid is the sale reversing. Return label cost is what it costs to get the goods back. They are typically an order of magnitude apart, and a combined figure hides that. Refunds carries the combined share of gross sales; labels carries a count instead, because "how often do we eat the label" is the number that changes a policy.
Priority brand, and margin kept
Priority brand is the brand whose returns are worth attention first, with its rate and sold count beneath. Under it, where there is one, sits a Likely cause to investigate line — a hypothesis, labelled as one.
Margin kept after returns shows the figure before and after, and states its coverage: "over the 62% of sold lines that carry a cost, not the whole business". A margin over a half-costed window is not a margin for the whole shop, and the tile says so on its face.
By brand
Sorted by what returns cost you — refunds plus labels, both shown as columns so the ordering is checkable rather than taken on trust. Observed reasons is what buyers picked from TikTok's menu, counted.
By live show
One row per show, clickable through to the show itself. The rate here is returns ÷ orders — a third denominator, and the column header says so, because it is not comparable with the brand rate directly above it on the same screen.
Buyers — a review queue, not a verdict
The most carefully built screen in the section, and the one most likely to be misread. It ranks buyers by how much a human should look at them. It does not accuse anyone of anything.
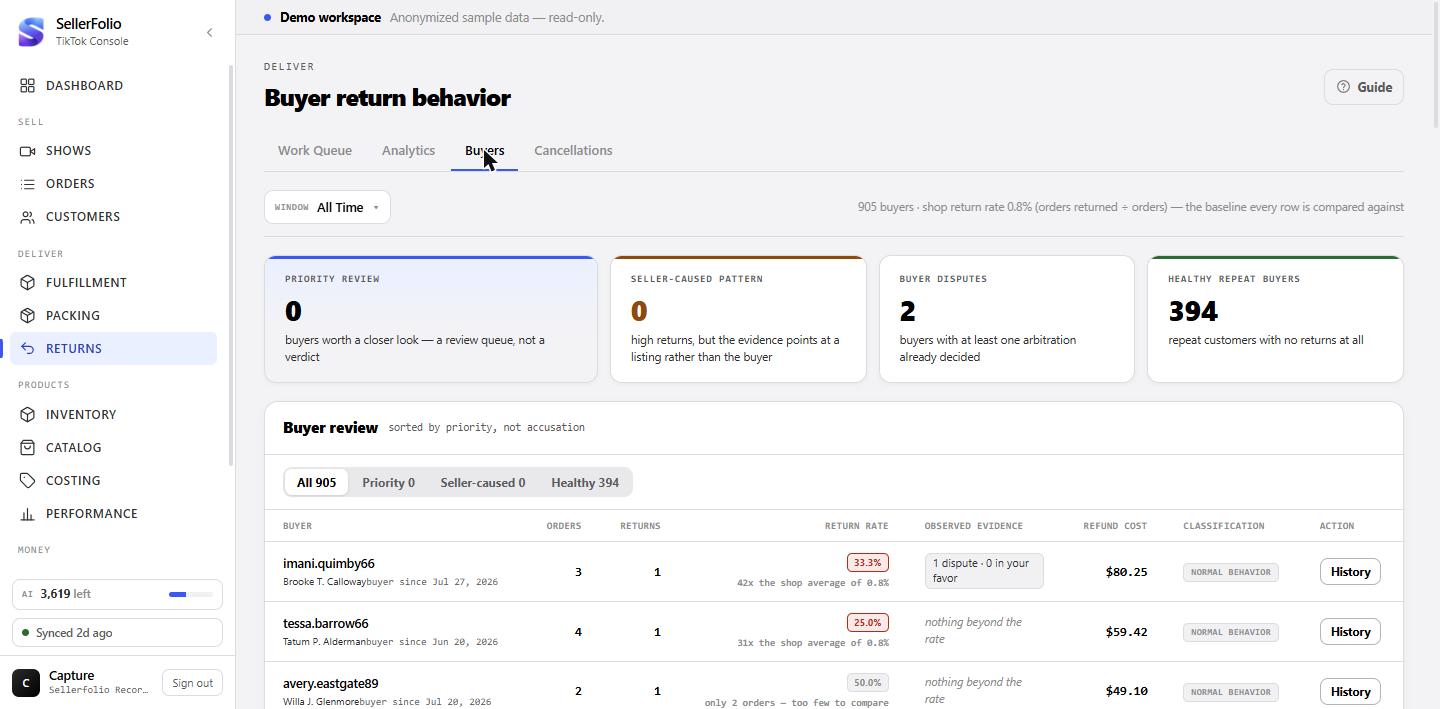
The baseline is stated before anything else
The line under the window picker gives the shop's own return rate — orders returned ÷ orders — and every row on the screen is compared against it. A bare 13.8% tells you nothing; "9x the shop average of 1.5%" tells you something.
The four tiles
Priority review is how many buyers are worth reading first. Seller-caused pattern is how many of the high-return buyers point at a listing rather than at themselves. Buyer disputes counts buyers with at least one arbitration already decided. Healthy repeat buyers is repeat customers with no returns at all.
The segments, and the missing search box
Four segments filter the table: All, Priority, Seller-caused and Healthy, each with its count. They page the server's own ordering rather than filtering the rows already on screen, so a segment shows every buyer in it, not just the ones on this page.
Reading a row
Orders and Returns are counts; Return rate carries the baseline note under it. Observed evidence holds up to three untoned chips — a concentrated SKU, a repeated reason, decided arbitrations — and they are untoned on purpose: a red chip is a judgement, and these are outcomes. Classification is the pill, and Action is the one thing you can do with the row, which is always to read it.
The evidence panel
Clicking a row opens a read-only panel in four blocks, and the block matching the row's action is highlighted:
- Observed — measurements only. The rate against the shop, the SKU concentration if there is one, the most-cited reason, and what arbitration has decided.
- Likely cause to investigate — hypotheses, labelled as hypotheses in the heading and on every line, so a reader who skims the heading still meets the word "investigate". When nothing in the data explains the rate, it says so — silence would be filled in with the worst available reading.
- Affected SKUs — the concentrated listing, its returned and bought counts, and how the cluster rule works.
- History — orders, return records, returned orders, rate, dispute record, refund cost.
Cancellations — orders that never shipped
Cancellations look like a big population and are almost entirely one thing. This tab separates the part you can act on from the part you cannot.
The split is the headline, not the total
Never paid is the biggest number here and the least actionable: the buyer did not complete checkout, so the money never existed. It is deliberately not styled as a problem — a red tile there would send you chasing checkout abandonment.
You could have prevented is the hero tile even though it is the smallest number: paid orders you then cancelled for a pricing error, a stock-out or a bad address. It is typically a small fraction of all cancellations by both count and value — and a screen headlining the full cancellation count would be accurate and useless.
Why they cancelled
One row per reason, with an Orders count, a Buyer had paid count — the column that separates lost revenue from an abandoned basket — and a Preventable flag reading Yours to fix or Not yours.
Where the preventable ones cluster
One row per show, ranked on preventable cancels alone. Rank it on total cancels and the top row is whichever show had the most abandoned checkouts, which tells you nothing you can act on. A show high on this list is worth a look at how its listings were priced and how stock was counted going in — those are the two reasons that land here.
The rules, in full
Everything the Buyers tab decides, the numbers behind it, and what these screens cannot see.
The five classifications
First match wins, in this order. That order is the argument.
| Classification | Applies when | Reads as |
|---|---|---|
| Seller-side issue | The buyer's returns cluster on one SKU, and that SKU's own return rate beats the shop's. | The listing, not the person. Evaluated first on purpose — a buyer who also meets every clause of the risk rule still lands here, because when a listing is returned by everyone the listing is the story. |
| Buyer-risk pattern | Return-watch flagged, and either 2+ orders with arbitration decided against you, or a rate at 4× the shop's across at least 2 returned orders. | The strongest reading this screen makes — and still only "read this first". |
| Needs review | Return-watch flagged, nothing above. | "Look at this", not "this buyer is bad". |
| Healthy repeat | 2+ orders, zero returns. | A retention segment. |
| Normal behavior | Everything else — which is nearly everyone. | Nothing to do. |
The thresholds
| Rule | Value | Why that number |
|---|---|---|
| Return watch | 3+ return records and a rate at 2× the shop's | The count is the evidence floor, the rate is the signal. Both must hold: three returns across 200 orders at a 1.5% shop rate is exactly average, and flagging it would punish a buyer for loyalty. |
| SKU cluster — evidence | 3+ return records naming one SKU | Three is a pattern, one is a Tuesday. Counted in records because seven items of one SKU coming back is seven pieces of evidence about that listing whether they shipped in one box or seven. |
| SKU cluster — concentration | 60% of the buyer's SKU-carrying returned orders | A share needs a bounded denominator to stay readable. This is why the panel can say "1 of 1" — three returns can arrive on a single order. |
| Risk by rate | 4× the shop rate, across 2+ returned orders | Twice the shop rate already earns the watch; four times is the second, higher bar. The order floor is there because a "pattern" over one order is a contradiction in terms. |
| Risk by dispute | 2+ orders lost at arbitration | One lost arbitration is an outcome; two is a record. Counted in orders because TikTok arbitrates item by item, so one shipment can produce several verdicts — that is one transaction decided piecewise, not two findings about a person. |
| Repeat buyer | 2+ orders | Orders before "repeat" means anything. |
| Rate comparison floor | 3 orders | Below it, no multiple is printed and the rate badge stays muted. At one or two orders the rate is pinned to 50% or 100% by arithmetic. |
The watch thresholds are per-shop settable, because the right cut differs by catalogue. The classification thresholds are fixed.
Three return rates, three denominators
These screens carry three figures all called a return rate. They are not interchangeable, and none of them is wrong.
| Where | Formula | Answers |
|---|---|---|
| Analytics — headline and brand rows | return records ÷ sold lines | How often does a thing we sold come back? |
| Analytics — by show | returns ÷ orders | How often does an order from this show come back? Untoned in the table on purpose, because the colour scale is built for the line-based rate above it. |
| Buyers — every rate on the tab | returned orders ÷ orders | How often does this person send something back? Bounded at 100% however many records exist. |
What these screens cannot see
Three signals people expect on a returns-abuse screen are absent, and they are absent because nothing in this system measures them — not because the buyers are clean:
- Reused return photos — would need perceptual image hashing.
- "Returned 6–9 days after delivery" — no delivered timestamp exists in this schema at all.
- Returned with tags removed — nothing records tag status.
Two more limits worth knowing: claim eligibility and filing deadlines are not exposed by the API, so Seller Center is the only place to check them; and brand grouping depends on show transcription, so an untranscribed window has no brands to group by.
Status vocabulary
TikTok's own return states, as they read in the queue.
| Reads | Means |
|---|---|
| Pending review | The request has arrived and is waiting on a decision. |
| Awaiting ship | Approved; the buyer has not sent the goods yet. |
| Item in transit | The buyer has shipped it back and it is still on its way. |
| Arrived — inspect | The returned parcel has reached you and TikTok is waiting on your decision. Same underlying status as "Item in transit" — separated because the job is the opposite one. Let the window lapse and the refund goes through on its own. |
| Refunded | Decided in the buyer's favour and settled. The money has moved and the case is closed. |
| Approved | Your decision on the request, not the end of it — the item may still be in the buyer's hands. It is drawn green because the decision is made, but it is still counted as open: it stays under the Open filter, and its refund is still inside your exposure figure. Treat the green as "nothing left for you to decide", not as "finished". |
| Rejected / Package rejected | The request, or the returned package on arrival, was refused. |
| Cancelled | The buyer withdrew the request. Excluded from the Buyers tab's counts. |
| Exchange / Replacement states | Mapped, but rarely seen. A replacement runs on a 24-hour response window rather than 48. |
| Won / Lost / In arbitration / Closed, no verdict | The dispute column. "Closed, no verdict" is not a loss. |
Habits worth keeping
Clear Needs response before anything else
It is the only part of Returns with a clock, and the clock resolves against you. Analytics will still be there afterwards.
Check the label cost before approving a return
Refund, keep item exists for the case where getting the goods back costs more than the goods. The queue prints your label cost on the row so the comparison is in front of you.
Check Seller-caused before you read a rate as behaviour
It is the smallest tile on the Buyers tab and the one that changes what you do. A buyer whose returns all land on a listing the whole shop returns is telling you about the listing.
Open the evidence before you report anyone
A rate on its own is not evidence of abuse, and this screen will never say it is. The panel exists so that the decision — which stays yours — is made on what the data actually holds.
Read Cancellations for the small number, not the big one
Never-paid is a checkout-abandonment rate and no amount of seller effort moves it. The preventable count is the one that responds to pricing discipline and a stock count.