Six questions, and the parts that answer them:
- The list — which broadcast, how big, how well it converted. (Part 1)
- Receipts & AI — capture each order's moment of the LIVE and let the AI read what was sold. (Part 2)
- The show page — the headline result of one broadcast. (Part 3)
- Timing — when the money arrived, hour by hour and minute by minute. (Part 4)
- Fees & payout — what the show kept after TikTok and after shipping. (Part 5)
- Audience — reach, buyers, who was in the room, and who spent the most. (Part 6)
There is a reference section at the end: every column, every rule and its reason, and an honest list of what this screen cannot see.
Every figure on this screen comes from one of two places, and they are measured by different systems:
- Your order book — orders, buyers, gross sales, payout, profit, and every timing figure. These exist as soon as the orders sync, during the show itself.
- TikTok's LIVE analytics for the room — the show's title, its start time, how long it ran, its GMV, items sold and unique viewers. These arrive in one fetch after the broadcast ends, and only once.
That split explains most of what looks odd here: a show that just ended has orders but no name and no duration; the GMV column and the Gross sales figure are two different measurements of roughly the same thing and will not match; and anything computed per hour needs TikTok's duration before it can exist at all.
Reaching Shows needs permission to read shows. Three things sit behind their own permissions on top of that:
- Naming a show needs permission to edit shows.
- ✦ Transcribe needs permission to spend AI credit — it is the one control here that costs money.
- Amounts need finance access. Without it every dollar figure on both screens
is removed before it leaves the server, and renders as
—— never as$0.00. Counts are not finance data, so orders, viewers, buyers, settled counts and costed-order coverage all keep working. The show page says so once, in a banner, rather than repeating it on every card.
The list of shows
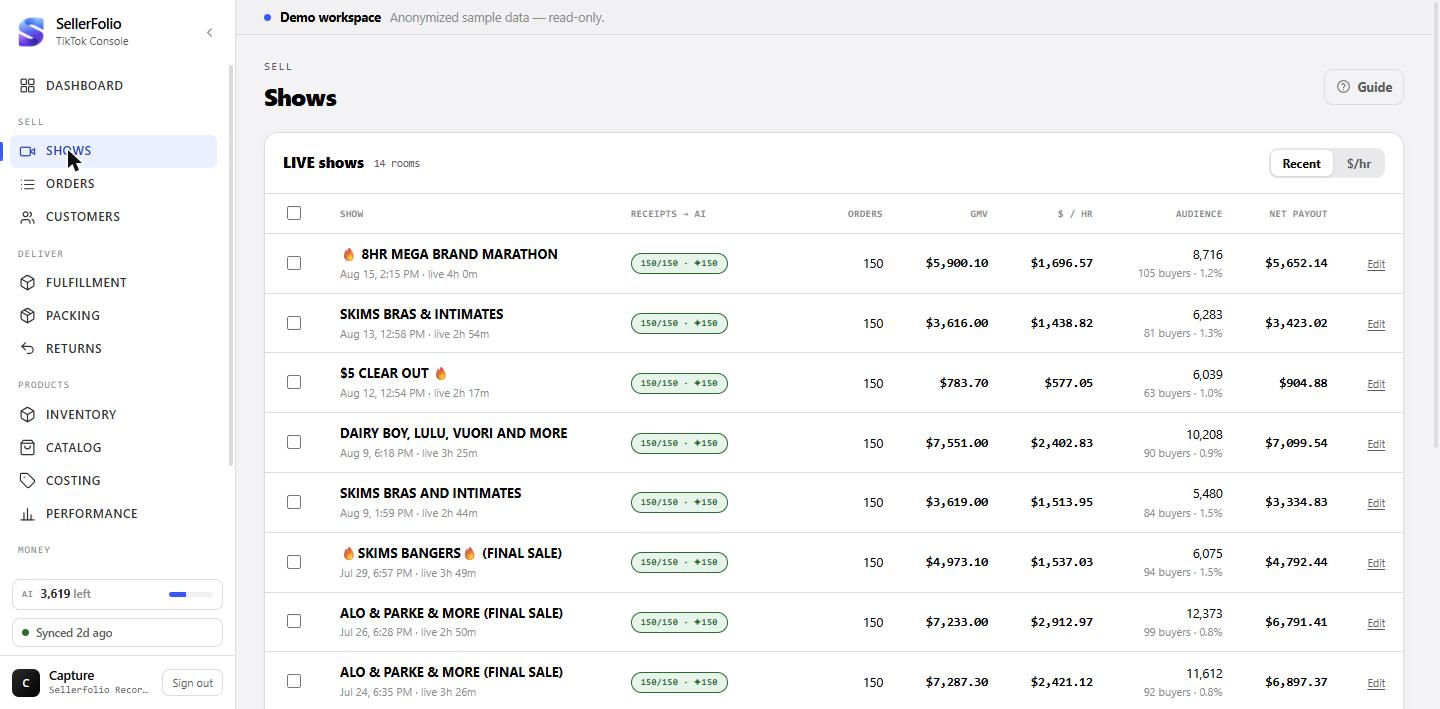
One row per LIVE room, newest last-order first.
What counts as a show
A show is a room — TikTok's id for one LIVE — and this list is built from your orders, not from a list of broadcasts. Every room that appears on at least one synced order gets a row. The consequence is worth holding on to: a broadcast that sold nothing never appears here at all, and a room's row exists from its very first order, mid-show, long before TikTok has anything to say about it.
If the table reads No LIVE rooms found yet — sync some orders first, that is the same fact from the other side: nothing has synced that carries a room id. A network failure says something different — Couldn't load your shows, with a Retry button — and it is careful to tell you your shows and everything captured against them are still there. The two used to look identical, which told a seller with a dead connection that they had no shows.
The name line, and what it falls back to
The first column is the show's name over a smaller line carrying its start and how long it ran. Both have fallbacks, and each fallback tells you something:
- Unnamed · …a1b2c3 — TikTok has not reported this room yet, and nobody has named it. The six characters are the tail of the room id.
- No "live 2h 14m" — same cause. Duration comes only from TikTok's post-show fetch.
- The date shown is the show's start time when TikTok has supplied one, and otherwise the time of its first order — a stand-in, not a measurement.
Clicking anywhere on a row opens that show's page. The checkbox and the Edit button do not — they are carved out so selecting and naming never navigate away.
The Receipts → AI column
One compact pill, and under it one line of plain English telling you what this show needs
next. The pill reads captured / orders · ✦transcribed — for example
205/219 · ✦29 means 205 of the show's 219 orders have a captured video receipt
and 29 of those have been through the AI. Hovering it spells the same thing out in words.
The line underneath is the useful half. It says exactly one of: capture receipts with the extension · AI transcription running server-side · N receipts not captured yet · N failed — select and transcribe to retry · captured — ready to transcribe · capture coverage can't be confirmed. When the pipeline is finished for that show the line disappears entirely: a finished show takes no space.
212 captured · 205 orders · ✦29. Hovering says how far over it is and why.
It reads that way rather than the two alternatives, both of which would be worse. A ratio over 100% is not a coverage. And capping it at
205/205 would claim the show is
fully captured when it may still be several receipts short — the shortfall cannot be worked
out from these two counts alone, because neither of them knows which receipts belong to the
orders that dropped out.
The line underneath follows the same rule: on a show in this state it says capture coverage can't be confirmed rather than disappearing, because a blank line means finished and finished is the one thing nobody here can prove. It sits behind every other line, so a failed transcript or an untranscribed receipt — both of which you can act on — still comes first.
The five number columns
Orders is a count from your order book — the room's selling orders, with cancelled, refunded and unpaid ones left out, the same rule the Orders ledger and Performance use. It is also the denominator the receipts pill measures capture against, which is what step 03's note is about.
GMV is TikTok's figure for the room, taken from its LIVE analytics when the show was resolved. It is not the sum of your orders and it is not refreshed afterwards — see Part 7 for why the two disagree and which one to quote.
$ / hr is ours: the sum of your orders' totals for that room
divided by TikTok's broadcast duration. It is the one column that needs both sources at
once, which is why it is the first to read —.
Audience is TikTok's unique-viewer count, with your own buyer count and the
conversion between them on the line below. Net payout is the sum of what
TikTok has actually said it will pay for the room's orders — blank until at least one of
them has been finance-synced, because a payout of $0.00 would read as a
measured zero rather than as "not known yet".
— means "we do not know this", and it is used in
preference to a zero that you could act on. If you see a zero, it was measured.
Sorting: Recent, or $ / hr
Recent is the default and orders by the most recent order in each room, so the show you just finished is at the top. That default matters — most visits to this screen are about the last show.
$ / hr ranks by money per broadcast hour, which is the fairest single comparison between a 90-minute show and a four-hour one. Shows with no rate — no duration yet, or too short to rate — sort to the bottom rather than being treated as zero: unknown is not the same as worst.
The Compare shows button on a show's page brings you back here already switched to $/hr, which is the fast way to answer "was that a good one?".
Naming a show
Name it (or Edit) opens a small dialog with two fields: the show's name and its start time. A name you type is yours and is kept — when TikTok's fill does eventually run on a room you have already named, it keeps your name and fills in only the rest.
The automatic fill only visits rooms that have no start time recorded — a saved start time is exactly what marks a room "already resolved". The dialog pre-fills that box from the show's first order when TikTok has not supplied a start, so saving a name on a fresh show also saves that stand-in time, and from then on the automatic pass skips the room: its real title, duration, GMV, items sold and viewer count never arrive, and $/hr and Audience stay blank for good.
Either name the show after it has filled in — the row will show a duration once it has — or clear the Started at box before saving.
Selecting shows
Ticking any row raises the dark selection bar at the top of the screen with two actions: Capture receipts and ✦ Transcribe. Both apply to every selected show. The header checkbox selects all, and Clear empties the selection.
If the capture extension is not installed, the bar says Install the extension to capture instead of offering the button — capture runs in your browser against TikTok, so it cannot happen server-side. Transcription can and does, so ✦ Transcribe is always available.
Receipts, and what the AI does with them
Two separate steps on purpose: capturing is free, transcribing costs credit.
What a receipt is
TikTok records, for each order placed during a LIVE, the exact moment of the replay at which that sale landed. A video receipt is that pointer — the replay's address plus the offset. Capturing it stores nothing but those two things.
Transcription is what turns it into words: the server cuts a short clip ending at the moment of sale, and the AI watches and listens to it to name what was being sold — the brand and the item. That identity is what Costing and Merch then work with, which is why capturing a show is usually the first move before costing it.
Capture receipts
Select the shows, press Capture receipts, and the bar counts through them one show at a time — Capturing 3 of 7…. Each show is attempted independently, so one failing does not abort the rest; the toast at the end names the ones that failed. Your selection is deliberately kept afterwards so a partial failure can be retried by pressing the same button again.
Receipts for orders that have not synced yet are parked rather than dropped, and attach themselves once the order arrives. The extension itself has its own guide — installing and pairing the capture extension →.
✦ Transcribe
This queues every captured receipt in the selected shows for the AI. It runs server-side —
you can close the tab. The toast tells you how many were queued and how many orders were
skipped for having no receipt, and a small ✦ 12/45 indicator appears in the
sidebar while the run is in flight, with an ✕ that cancels whatever is still queued
(anything already being processed finishes, because its credit is already spent).
The button greys out while any selected show has work in flight, so a second press cannot pile a second run on top of the first. Work in an unrelated show never blocks it.
Low confidence, failures, and paused progress
Low conf. in the pill's tooltip means the clip could not be located confidently — the AI read something, but the window it read may not be the moment of that sale. It happens when neither TikTok's own replay offset nor the replay's timing data could place the order, in which case the clip is cut from the start of the replay rather than silently transcribing the wrong minute. Treat those identities as suggestions.
Failed usually means the clip could not be built — most often an expired replay link, which a fresh capture fixes.
If a toast says Transcription progress updates paused — reload to resume watching, the progress counters have stopped refreshing; the work itself carries on. Reload the page to start watching again. While paused, the counts you see are frozen at their last known values.
The show page: the headline
One page per broadcast. Click any row on the list, or use an old ?show= link —
those still work and redirect here.
The header line
Under the show's name: when it started, how long it was live, the last six characters of
the room id, and a green Settled n/m pill counting how
many of the show's orders TikTok has finalised. A show that ended days ago and still reads
Settled 0/240 has simply not been settled yet — settlement is TikTok's clock,
not yours.
An amber Shipping cost pending pill appears when some of the show's orders charged the buyer for shipping but TikTok has not yet billed the carrier label. That is normal for a recent show, and Part 5 explains what it does to the profit figures.
Gross sales
The sum of every order attributed to this room. Underneath it: money per broadcast hour, per minute, and the average order value — which is simply gross ÷ orders, not a separate measurement.
The second line, TikTok Live GMV, is TikTok's own figure for the same broadcast, printed right beneath ours precisely so the difference is visible rather than hidden. Part 7 covers why they differ.
Use All orders in the header to put them back and see the room's whole order book. The switch changes every figure on the page, not just this tile — and while it is on the rank chips go dark. Every other show they would compare this one against is counted on sold orders only, so a place gained across that line would have been bought by counting orders that never sold. A short note appears where the chips were, saying so; switch back to Sold and they come straight back.
Net profit, and its three states
This tile can say three quite different things, and they are not interchangeable:
- A figure — with the margin, the profit per hour, and a line saying over 180 of 240 orders costed. Read that line: both the profit and the margin cover only the costed orders.
- Not costed — no order in this show has a recorded product cost yet, with a link straight to Costing.
- — with "Profit is finance data" — you are viewing without finance access. The show may be perfectly well costed; you simply cannot see the amount.
The margin beside it is net profit divided by the net sales of the costed orders, not by gross sales. This is deliberate and it matters: dividing by all orders' gross in a partly-costed show understates the margin badly, and the correct one is what Reports shows too.
A ⏳ est. tag on the margin line means some shipping cost in this show is still unbilled, so net profit is provisional and will move as labels land.
Orders, Audience, and the return window
Orders carries the count, orders per broadcast hour, and the cadence — 1 every 1.8 min — which is often the more useful of the two when you are thinking about how hard a segment was working.
Audience is TikTok's unique-viewer count for the room, the share of them who bought, and your buyer count. Both halves of that percentage come from different systems: viewers from TikTok, buyers from your orders. It exists only once TikTok has reported the show.
Return window answers the question every other tile on this strip quietly depends on: is this show finished? It shows the share of the show’s orders that are past their return window, how many are settled out of how many have a window at all, and how many can still come back.
An order counts as settled when TikTok marks it Completed, which is its own verdict that the return period has lapsed. Cancelled orders are excluded entirely — nothing came back because nothing was kept. The dollar figure is the delivered money still inside its window, and it is the only part of the tile that finance access hides; the counts and the percentage always show.
The rank chips
Under each headline tile sits a small #3 of 41 chip ranking this show against your others on that measure. Three things about them are worth knowing.
First, each chip has its own denominator, and they will not agree. A show is only counted on a measure where that measure exists for it — a show with no costed order has no profit per hour, and counting it would both inflate the "of N" and imply it ranked last. So profit may read #3 of 41 while conversion on the same page reads #8 of 79. Both are honestly sized; they are different questions asked of different sets of shows.
Second, the profit chip arrives late, or not at all. It needs a workspace-wide profit pass that runs separately from the rest of the page and is cached for a minute; nothing else on the page waits for it. If you have just entered costs on Costing, the chip may take up to a minute to notice.
Third, a chip is withheld whenever this show and the list it would be ranked against are not measuring that figure the same way. A rank is a comparison, and a comparison is only a fact when both sides are the same measurement — so the page checks its own figure for this show against this show's own entry in the comparison list, and if the two disagree it prints no chip at all rather than a place it cannot stand behind. Turning on All orders (step 13) is the case you will actually meet: it re-measures this show on cancelled, refunded and unpaid orders too, while every show it would be ranked against stays on sold orders only. Whenever a chip is withheld, a line above the tiles says so — a chip that was there a click ago and is gone now is never left to look like a bug.
Timing: when the money arrived
Three views of the same orders — a curve, bars, and a table — plus one control that ties them together.
Money pace — the cumulative curve
The solid line is cumulative sales from the start of the broadcast to its end. The dashed straight line is what a perfectly even pace would have looked like. Above the dashed line the show is running hot; below it, behind. The steepness at any point is how fast it was selling right then — which is the thing a bar chart cannot show you.
Hovering reads off the running total at that moment. The Gross / Orders toggle switches the same curve between money and order count. Without finance access the toggle is not offered at all and the curve counts orders — the shape of the show survives even when the amounts do not.
Selling intensity — the bars
The same orders in fixed windows of 5, 10 or 30 minutes, so you can see the rhythm of the show rather than its total. The busiest window is filled solid. Hovering a bar gives its money, its order count and how many items those orders carried.
Empty windows are kept. A dead ten minutes mid-show is the signal this chart exists to show; dropping it would close exactly the gap you want to see. The line under the chart names the peak window and how it compares to a typical one — 3.4× the average interval.
Hour by hour, and scoping the page
The table gives each hour of the broadcast its gross, orders, average order value, dollars per minute and share of the show, with the best hour tagged. The final row is usually short, and it says so — (37 min) — because otherwise its dollars-per-minute would be nonsense.
Unlike the intensity chart, hours with no orders are not listed. The chart is about rhythm and needs the gaps; the table is a list of what happened.
Clicking an hour scopes the whole page to it. A bar appears at the top of the page saying what is scoped and offering to clear it; both charts dim everything outside the hour, and the Pace breakdown card recomputes over it. Clicking the same row again, or the ✕ on the scope bar, clears it.
The Pace breakdown card
The same window's timing in words. Two rows repay attention:
- First sale — the clock time of the first order and how long after the show's start that was. A long ramp usually means a slow warm-up segment, and it is one of the few numbers here you can change directly.
- Half of gross by — when the show had banked half its money, and what share of the broadcast that was. Well under 50% means the show front-loaded; well over means it closed strong.
Quietest 30 min is always measured in 30-minute windows whatever the intensity chart is set to, so it stays comparable between shows. Everything on this card except net profit per hour recomputes when an hour is scoped.
Fees & payout
What the show earned after TikTok's cut and after shipping — and, just as importantly, which orders each line covers.
The finance-synced count in the card header
n/m finance-synced is the first thing to read here. TikTok
reports the money for an order some time after the sale, and until it has, that order
contributes nothing to this card. At 0/240 the card says so plainly and shows
nothing else: no order in this show has been finance-synced yet, so fees and payout are
unknown. That is a waiting state, not a bad show.
The rows, and what each one covers
The bars scale against the show's gross so each line reads as a share at a glance.
- Gross sales — every order in the room.
- Fees & taxes — the sum of TikTok's own fee legs across every finance-synced order.
- Shipping charged to buyers — what buyers paid to ship, across every finance-synced order. Known at the moment of sale, so it never waits on a label.
- Actual shipping cost — what the carrier labels actually cost, over the orders TikTok has billed.
- Shipping adjustments — shown only when it is not zero. Late shipping refunds and surcharges TikTok posts that the two rows above do not describe.
- Product profit — the goods margin over the costed orders: net sales less product cost less in-flight return costs. It contains no fees and no shipping, which is why it reads as a true markup rather than being penalised by TikTok's cut.
- Shipping margin — buyer-paid less actual, counted only on orders whose label cost has posted.
- Net profit — product profit, plus the fees on those same costed orders, plus the realised shipping margin.
- Net payout — what TikTok disburses. It draws no bar, because it is not a term in the profit arithmetic; it is a different question sitting at the bottom of the same card.
Why "Actual shipping cost" is a dash
TikTok bills the carrier label roughly 10–14 days after the sale. Until it
does, there is no cost recorded at all — and printing $0.00 would assert that
your labels were free and that shipping made a perfect margin. So a show whose labels have
not been billed shows — with a not billed yet tag, and the
line underneath carries the half that is known — for example, $412.80 charged
· cost pending on 96 orders.
The same discipline runs through the rest of the card. Shipping margin counts an order only once its cost has posted, so it converges up to the truth as labels land rather than starting optimistic and falling. The ⏳ est. tags on shipping margin and net profit mean exactly that: provisional, will move.
That identity holds over the orders whose labels have been billed. When some are still pending, the Shipping charged to buyers row still includes their buyer charges — so the three rows overshoot the margin by exactly the pending amount printed in the line below the card. If the arithmetic looks off by a suspiciously round-ish number, that is the number.
Audience and buyers
Who watched, who bought, and who bought most.
Audience → buyers
Four bars — impressions, viewers, buyers, repeat buyers — with the conversion between each pair spelled out. Impressions is how many feeds TikTok put the LIVE in front of, so the first conversion separates "nobody was shown this" from "people were shown it and scrolled past". It only appears once the show has been resolved.
Repeat (2+) means a buyer who placed two or more orders within this one show: they came back mid-broadcast. It is not a measure of loyalty across shows — that is the card below, Who was in the room, which sorts the night's buyers by what they were before it started: first-time, second order, repeat, or VIP. The two answer different questions, and a good night can be either one.
Below the bars, gross per impression, per viewer and per buyer. Gross per viewer is the one that moves when the audience changes rather than when the merchandise does — it is the closest thing on this screen to "was this a good room to be in".
Viewer counts are TikTok's, so the whole card reads — rather than zero when
TikTok has not reported the show yet. Where the shop's rooms have been reported, viewers
and buyers are both present on every one of them.
Top buyers
The show's seven biggest spenders, with their order count, a share bar and their share of the show's gross. Buyers with equal spend are ordered consistently rather than by whatever order the database happened to return, so the list does not reshuffle between visits.
A buyer with no nickname on record shows as their TikTok user id — that is a display gap, not a different kind of buyer. The line at the bottom totals the seven as a share of the show, which is the concentration question: seven buyers at, say, 18% of a show's gross is a very different business from the same seven at 60%.
Without finance access the ranking still appears — it is ordered by spend — with the amounts hidden.
What sold — by brand
A bar across the show's brands, and a table under it. Click a brand to open the items sold within it. Money and Units answer different questions and routinely rank the brands differently — one expensive piece can lead on money while another brand moved five times the units — so the toggle changes the bar, the ranking and the share column together, and never mixes the two denominators in one view.
Cost and Margin cover the lines of that brand which have a cost recorded — not all of them. The cell says which: the cost prints the sales it was measured against, and the margin prints how many of the brand's items are costed. That is deliberate, because subtracting Cost from Sales would give a margin the recorded costs never covered. Returned counts that brand's orders with a completed return, so a brand that moves well and comes back often stops hiding behind its sales column.
Brands come from the AI identity on each order's recording, which means two things worth holding on to. An order counts under one brand for every item on it — if a buyer's order had three pieces and the recording named one brand, all three sit under that brand. And orders with no identity are not dropped: they collect in a "Not identified" row, pinned last however large it is, so the items column still adds up to the show's Items sold. The line under the table says how much of the show is identified; read it before treating the split as the whole show.
Only the first seven brands get their own colour — the rest fold into one "more brands" segment on the bar, while the table keeps listing every one of them. A colour belongs to the brand and not to its place in the ranking, so flipping Money and Units never swaps two brands' colours under you. Without finance access the card still works: the bar, the ranking and the shares switch to units, and the Sales column drops out rather than showing a column of dashes.
When there is no brand to draw, the card says which kind of nothing it is, because the four cases send you in four different directions. Nothing has sold — there is nothing here to attribute yet. This show hasn't been transcribed yet — the items sold are there, nothing has been read; select the show on Shows and hit ✦ Transcribe. Transcribed, but no brand was named — the transcripts finished and none of them named a brand, so running the AI again would re-bill you and change nothing; name the products on Catalog, or correct an order's identity from Costing. And No brand was named in this hour, which only appears when the page is scoped to an hour.
Scoping the page to an hour does recut this card — but only as far as it honestly can. Units, orders and both share columns are re-derived for the window. Cost, margin and returns are not: they are per-item and per-return facts belonging to the whole show, and an hour's share of them would be a different number under the same column heading. They come back blank instead, and a line under the table says the card is scoped. Clear the hour to get them back.
When two figures disagree
Every one of these is expected behaviour with a reason behind it.
GMV does not match Gross sales
They are two different measurements taken by two different systems. Gross sales is the live sum of your synced orders for the room and moves as orders sync. GMV is TikTok's own figure, fetched once when the show was resolved and not refreshed afterwards — it is a snapshot of what TikTok thought the room had done at that moment.
For anything you are going to act on — costing, margin, payout — use gross sales, because it is the figure the rest of this app is built from. Use GMV to sanity-check that your order book caught the whole show.
The show's margin differs from the same show on Reports
It should not, and both screens now divide net profit by the net sales of the costed orders. If a margin ever looks far too low, the classic cause is dividing a costed-subset profit by an all-orders gross — the two are not comparable in a partly-costed show, and the gap can be a third of the figure.
Net profit changed since yesterday and nothing was sold
Three things move it after the show: costs entered on Costing (coverage rises, so the costed subset grows), shipping labels being billed (margin converges up), and returns completing. A show's profit is not final until its orders are settled and its labels billed.
A show that just ended has no name, duration, GMV or viewers
Expected for up to an hour after the last order. While a LIVE is still broadcasting TikTok's analytics has no record of it at all — asking returns a "precondition required" error, not an empty result — so the fetch is deferred until the room has been quiet for 60 minutes. Nothing is marked or lost; the next sync after that window fills the row in. Orders, buyers, the timeline and the whole money side are already there in the meantime.
$ / hr is a dash on a show that clearly sold
A per-hour rate needs a duration, and duration comes only from TikTok's post-show fetch. Either the show has not been reported yet (see above), or it has been marked as already resolved by a saved start time (Part 1, step 06). Rates are also withheld for anything under 15 minutes of broadcast, where a rate is arithmetic noise rather than a measurement.
Every column, every rule
What each figure is, where it comes from, and when it is deliberately blank.
The columns on the list
| Column | Source | What it is, and when it is blank |
|---|---|---|
| Show | Both | Your name for the show, or TikTok's LIVE title, or Unnamed plus the room id's last six characters. The second line is the start time — TikTok's if known, otherwise the first order's — and the broadcast length, which only TikTok supplies. |
| Receipts → AI | Capture pipeline | captured/orders · ✦transcribed, or
N captured · M orders · ✦transcribed when the two counts are not over
the same orders and a coverage figure cannot honestly be divided (step 03). Hover
for the same thing in words; the line beneath says what to do next. |
| Orders | Order book | The room's selling orders — cancelled, refunded and unpaid ones are left out, the same rule the Orders ledger and Performance use. It is also the denominator the receipts pill measures capture against. |
| GMV | TikTok analytics | TikTok's GMV for the room, captured once at resolve time. Blank until the show is resolved, and hidden without finance access. |
| $ / hr | Both | Your gross for the room ÷ TikTok's broadcast hours. Blank with no duration, under 15 minutes of broadcast, or without finance access. |
| Audience | Both | TikTok's unique viewers, over your buyer count and the share of viewers who bought. Blank until the show is resolved. |
| Net payout | Order book | Σ of TikTok's payout for the room's orders. Blank until at least one order is finance-synced; hidden without finance access. |
Which orders each money figure covers
The single most useful table here. "Costed" means every one of an order's remaining lines has a recorded product cost; "billed" means TikTok has posted what the carrier label cost. Every row below is over the room's selling orders — cancelled, refunded and unpaid are out — and All orders in the header widens all of them at once, so "all" in the Covers column means "all of whichever set the header is showing".
| Figure | Covers | Note |
|---|---|---|
| Gross sales | The room's selling orders | Cancelled, refunded and unpaid orders are left out. All orders in the header puts them back — and takes the rank chips away while it is on (step 16). |
| Fees & taxes | All finance-synced orders | TikTok's own fee legs, as a negative. |
| Shipping charged to buyers | All finance-synced orders | Known at the sale; does not wait for a label to be billed. |
| Actual shipping cost | Billed orders only | — while none is billed. Never $0.00. |
| Shipping margin | Billed orders only | Converges up as labels land; tagged ⏳ est. while any are pending. |
| Product profit | Costed orders only | Net sales − product cost − in-flight return costs. No fees, no shipping. |
| Net profit | Costed orders + billed shipping | Product profit + those orders' fees + realised shipping margin. |
| Margin % | Costed orders only | Net profit ÷ the costed orders' net sales — the same base Reports uses. |
| Net payout | All orders with payout data | What TikTok disburses. Not part of the profit arithmetic. |
| Top buyers' spend | All orders | Per buyer, per show; the top seven only. |
Rules and thresholds, with their reasons
| Rule | Value | Why that value |
|---|---|---|
| Minimum broadcast to quote a rate | 15 minutes | Below it a rate is noise — a five-minute room with two orders would claim thousands per hour. A real broadcast sits far above the floor, so this guards a malformed record rather than a real show. |
| Quiet window before fetching a show's stats | 60 minutes since its last order | TikTok's analytics has no row for a LIVE that is still running, so asking mid-show fails every time. Erring long costs a late show name; erring short would file an error for every show, forever. |
| Automatic fill visits | Rooms with no start time recorded | Runs after every order sync. A saved start time is what marks a room done — see Part 1, step 06. |
| Intensity windows | 5, 10 or 30 minutes | Fine enough to see a segment, coarse enough not to be a list of orders. |
| Quietest window | Always 30 minutes | Fixed so it stays comparable between shows whatever the chart is set to. |
| Hour rows | Only hours with at least one order | The table lists what happened; the chart keeps the gaps. |
| Top buyers | 7 | Enough to show concentration, short enough to read. |
| Coloured brands on the bar | 7 | Past seven, a stacked bar stops being readable and the legend runs to two lines. The rest fold into one segment; the table below still lists every brand. |
| Items shown under a brand | 6, then "+N more" | A single show can carry well over a hundred distinct items, which is a wall rather than an answer. |
| Profit rank refresh | Cached 1 minute per workspace | The pass reads every order and line in the workspace. A minute makes repeat views free and still lets a cost you just entered show up while you are looking for it. |
| Carrier label billing lag | ~10–14 days after the sale | TikTok's clock, not ours. It is the reason shipping margin and net profit on a recent show are marked provisional. |
| Chart window | From the earlier of start and first order, to the later of broadcast end and last order | A room can carry a start time hours after its own first order, which would push its whole curve off the chart; the far end is stretched for the same reason in reverse. A chart that can silently drop an order is not worth shipping. |
What this screen cannot see
- Anything about a broadcast that sold nothing. Rooms are discovered from orders.
- Viewers, watch time or impressions of your own measuring. Every audience figure is TikTok's, arrives once, and is absent until the show is resolved.
- A second brand on the same order. "What sold — by brand" reads the AI identity, which names one brand per ORDER, so a mixed order counts wholly under that one brand. Per-item identity lives on Costing and Merch.
- Cost or returns for a single hour. Scoping to an hour recuts the brand card to units, orders and share. Cost, margin and returns belong to items and to return records, not to the minute an order landed, so those columns wait for the whole show — the card says so when it is scoped.
- Cost that has not been entered. An uncosted order is not in product profit, net profit or the margin, and the costed-of-total line on the Net profit tile is the only warning you get.
Habits worth keeping
Let a show fill in before you name it
Wait until the row shows a duration — that is proof TikTok has reported it — and the name you then type will stick without costing you the show's stats.
Capture freely, transcribe deliberately
Capture is free, safe to repeat and only stores a pointer, so there is no reason to put it off; if a transcription later fails on a dead replay link, capturing that show again gets a fresh one. Transcription spends credit and re-runs everything you select, so aim it.
Read the costed-of-total line before quoting a profit
"Net profit, over 180 of 240 orders costed" is a different sentence from "net profit". The second one is how a good show turns into a bad surprise.
Compare on $ / hr, not on totals
A four-hour show will out-total a ninety-minute one almost regardless of how it went. Rate per broadcast hour is the comparison that survives a change of schedule — and the Compare shows button is one click from any show page.
Come back to a recent show once, a fortnight later
Labels bill, orders settle and returns complete inside about two weeks. A show read the morning after is a provisional read; the same page a fortnight on is the real one.